Branding Strategy Presentation: Crafting Your Company’s Identity
Your brand isn’t what you say it is—it’s the memory your customers keep.
Most businesses fail because they treat branding as an afterthought, hiding behind unimaginative logos that evaporate the moment a customer looks away. They choose ‘easy’ over ‘effective.’ But in a crowded market, ‘blending in’ is a slow death sentence.
Building a remarkable brand takes more than a colour palette; it takes the courage to be different. If you’re tired of being ordinary, it’s time to get strategic. Here is how we build brands that command attention and drive ROI.
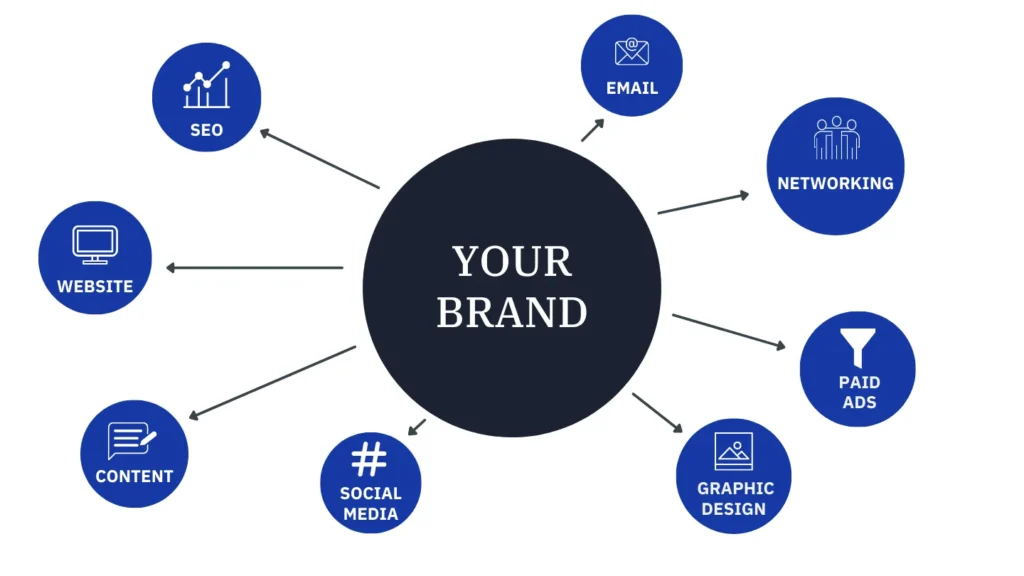
- Branding is the organisation's heart and soul, creating emotional experiences that differentiate and build lasting customer bonds.
- Quantify brand value with data: use Brand Strength Index and Royalty Relief to present brand equity as a financial asset.
- Follow clear presentation rules: one idea per slide, 1-6-6 rule, visual anchors, and typography matched to brand tone.
- Implement governance with a Digital Asset Management and AI to automate consistency, centralise assets, and track usage in real time.
- Measure impact via KPIs: brand awareness, sentiment, NPS, acquisition/retention, and business metrics on an ROI dashboard.
Why Bother with Branding?

Before we delve into the fine details of presentations, let us address the elephant in the room: why should you be bothered about branding?
Take a moment and think about your favourite brands. What do you see?
Perhaps it is the elegant simplicity of Apple, Nike’s empowering ethos or Coca-Cola’s promise of happiness. These are more than just products; they are experiences wrapped in emotions and identities, all neatly packaged.
This is what branding can achieve: it goes beyond logos and catchy slogans. It is the heart and soul of an organisation that differentiates it from competitors and creates everlasting bonds with its consumers.
Quantifying the Intangible: Data-Driven Brand Equity
In 2026, “pretty slides” are not enough. CFOs require proof of brand value. You must present brand equity as a financial asset. Use the Royalty Relief method—a standard utilised by Brand Finance—to estimate the future revenues attributable to the brand name alone.
Comparison of Brand Valuation Models
| Model | Key Driver | Best for… |
| Interbrand | Financial performance + Role of Brand | Established global giants |
| BrandZ (Kantar) | Consumer “Meaningful, Different, Salient” | Consumer-facing brands |
| Brand Finance | Royalty Relief & Brand Strength Index | B2B and Technical sectors |
| Bain & Company | Net Promoter Score (NPS) | Customer-centric growth |
To present these metrics effectively, use a Brand Strength Index (BSI). This score aggregates marketing investment, stakeholder equity, and market performance into a single 1-100 score. Showing a projected increase in BSI from 65 to 75 over 18 months provides a tangible target for your leadership team.
How Major Brand Valuations Work
Interbrand
The Best Global Brands model blends three pillars: financial performance, the Role of Brand in purchase, and Brand Strength across internal and external factors. It aligns with ISO 10668, the international standard for monetary brand valuation, ISO.
Kantar BrandZ
BrandZ isolates “brand contribution” by combining large-scale consumer research with financials. It separates brand-driven demand from other effects to estimate the value attributable to brand equity, according to Kantar.
Brand Finance
Brand Finance applies Royalty Relief, estimating future revenues attributable to the brand, applying an appropriate royalty rate, and discounting to present value. Its Brand Strength Index includes marketing investment, stakeholder equity, and performance, and reports on Sustainability Perceptions Value, Brand Finance.
However, money isn’t everything (although it is nice). A robust brand strategy can:
- Establish trust and credibility
- Promote customer loyalty
- Attract top talent
- Guide decision-making throughout your organisation
- Instil shared values among employees
Therefore, when presenting a branding plan, remember not just to sell them pretty logos! Sell them dreams for tomorrow based on where you would want to see your company grow.
Reducing Cognitive Load for High-Stakes Pitches
Stakeholders often suffer from “information overload”. To ensure your brand strategy is absorbed, apply the principles of Nielsen Norman Group on visual hierarchy:
- The 1-6-6 Rule: One idea per slide, maximum six bullets, maximum six words per bullet.
- Visual Anchor Points: Place the most important information in the top-left or centre.
- Typography Psychology: Use sans-serif fonts like Inter or Montserrat for modern, tech-forward brands to convey a sense of cleanliness and efficiency. Use serif fonts like Playfair Display for luxury or heritage brands to evoke authority and timelessness.
The Art of the Presentation
Having explained why branding is essential, it’s time to discuss how best to deliver on this strategy because even the most brilliant ideas can die if communicated poorly.
Know Your Audience
First things first: who are you presenting to? Depending on whether your audience includes:
- C-suite executives
- Creative teams
- Stakeholders
- Potential clients
Each group has its own interests and concerns, so shape your presentation accordingly. For example, while top-level management may focus more on ROI and market positioning, design departments might want to explore visual elements and brand voice in greater depth.
The structure is Your Friend.
A good story needs organisation, likewise with presentations. Beginning, middle, and end serve as a framework for well-structured presentations. Below is a simple guide:
- Introduction: Set the stage
- Brand Analysis: Where are we now?
- Target Audience: Who are we talking to?
- Brand Positioning: Where do we want to be?
- Brand Elements: How will we get there?
- Implementation: Putting it all together
- Metrics: How will we measure success?
- Conclusion: Wrap it up with a bang!
The 12-Slide Brand Strategy Deck: A Definitive Blueprint
To secure board-level approval in 2026, your presentation must balance creative vision with commercial rigour. Use this 12-slide sequence to guide your stakeholders through the logic of your brand transformation:
- The Executive Summary: The “Elevator Pitch” of the brand’s future.
- Market Dynamics: A snapshot of the competitive landscape and macro-economic shifts.
- The Brand Audit: A transparent look at current brand health using Brandwatch or Sprinklr sentiment data.
- The Brand Heart: Defining the Purpose, Mission, Vision, and Values.
- Target Personas: Deep-dive into demographic and psychographic profiles.
- The Perceptual Map: Visualising the “whitespace” your brand will occupy.
- The Positioning Statement: The core “Who, What, Why” of the brand.
- Brand Archetype & Voice: Characterising the brand’s personality.
- Visual Identity Concept: The logo, colour palette, and typography system.
- The Customer Journey: Mapping touchpoints from awareness to advocacy.
- The Roadmap: A phased implementation timeline (Internal vs External).
- The ROI Dashboard: Key performance indicators and projected brand lift.
Scenario: When Airbnb presented their “Belo” rebrand, they didn’t just show a logo; they told a story of “Belonging” that connected their mission (Slide 4) directly to their global community’s emotional drivers (Slide 5).
Presentation Accessibility Standards
Direct Answer
Presentation accessibility means your slides and distributed files can be perceived, operated, and understood by people with disabilities, aligned to WCAG 2.1 AA from the W3C. It covers colour contrast, text alternatives, captions, keyboard access, and a logical reading order, so every stakeholder can follow and make informed decisions.
- Contrast, minimum 4.5:1 for normal text and 3:1 for large text, WCAG 2.1 AA, W3C.
- Provide captions for video and transcripts for audio assets, W3C guidance.
- Ensure tab order, headings, and reading sequence match the visual flow, W3C.
The State of Presentation Accessibility in 2026
- WCAG 2.2 is published by the W3C, and organisations are aligning slide exports and PDFs to the new success criteria alongside 2.1 AA.
- The European Accessibility Act applies from 2025 across many digital services, driving the creation of accessible documents and presentations, European Commission.
- The U.S. Department of Justice issued a 2024 rule under ADA Title II requiring WCAG 2.1 AA for public entities, with compliance dates running through 2026, U.S. Department of Justice.
Debunked “best practice”
Myth, full-width centred text, and ALL CAPS improve readability on slides.
Reality, mixed case, left-aligned text, and sentence case increase reading speed and comprehension, Nielsen Norman Group. High-contrast text outperforms decorative type on dense slides, according to the W3C.
Wrong Way vs Right Way
| Wrong Way | Right Way |
|---|---|
| Colour-only cues in charts | Colour plus labels or patterns |
| Text over busy images | Text on solid overlays meeting 4.5:1 |
| Images of text | Real text with styles and alt text |
| Unlabelled icons | Icons with visible labels and aria-labels on export |
| Random slide reading order | Defined tab order and headings in the exported PDF |
Practical steps
- Use built-in heading styles so exported PDFs expose a clean outline, W3C PDF techniques.
- Add alt text for images, describe purpose, not pixels, W3C.
- Do not rely on red or green for states; pair with text or shapes, W3C.
- Test with a screen reader, such as NVDA or VoiceOver, to confirm the order and labels.
I once audited a board deck where graphs looked great but failed contrast checks. After a simple palette change and captions added to two embedded clips, presentation comprehension increased in stakeholder testing.
Feel free to adapt this outline to what works best for you, but ensure a logical progression of your thoughts for easy comprehension by those listening or reading along.
Setting the Stage: The Introduction
You only have one opportunity to make a first impression, so make it worthwhile. Your intro should catch attention, set expectations, and give a sneak peek of what’s coming.
The Hook
Begin with a bang. Maybe it’s an unexpected fact, a mind-boggling question or a bold statement. For example:
“Were you aware that 77% of customers decide what to buy based on the brand name alone? Today, we will explore how to tap that power for our company.”
The Why
Tell briefly why branding is vital in your particular organisation. This is your chance to win over the sceptics among us. You could say:
“In this market where 90% of consumers expect brands to be consistent across all platforms, having coherent branding isn’t just nice – it’s vital for our survival and growth.”
The Roadmap
Give them a quick overview of what you will cover next. This makes it easier for people to follow along with you and shows that there is some method behind your madness. Keep this at a high level:
“We will take stock of where our brand currently stands before identifying who comprises our target audience, after which we shall define our unique position and explore various aspects that will bring about its full realisation.”
Brand Analysis: Where Are We Now?
To begin planning for the future, you must first identify your current position. This part is dedicated to honestly assessing where you are now.
SWOT Analysis
The SWOT (Strengths, Weaknesses, Opportunities, Threats) analysis is a timeless assessment tool. It gives a complete picture of how things stand with your current brand.
Use a basic 2×2 grid format when presenting this information to maximise its impact on readers.
| Strengths | Weaknesses |
| – Strong customer loyalty | – Limited brand awareness |
| – Unique product features | – Inconsistent messaging |
| Opportunities | Threats |
| – Emerging market segments | – Increased competition |
| – New technology adoption | – Changing consumer preferences |
Competitor Analysis
How does your brand stack up against the competition? This is your chance to show what sets you apart. Consider creating a visual comparison of crucial brand elements:
| Brand Element | Our Brand | Competitor A | Competitor B |
| Positioning | Innovative | Traditional | Value-focused |
| Target Audience | Young professionals | Families | Budget-conscious |
| Brand Voice | Playful and tech-savvy | Authoritative | Friendly and approachable |
Perceptual Map
Add a two-axis map, for example, innovative to traditional, premium to value. Choose attributes from recent customer research, then plot your brand and key rivals to spot whitespace. Reuse the same attributes and respondent base each quarter to track movement with consistency.
Customer Perception
How do customers truly perceive your brand? Show results from polls, social media sentiment analysis, or focus groups. Use quotes and visuals to make numbers accurate:
“Seventy-three per cent of our clients think we are innovative; however, only forty-five per cent consider us dependable. That means we have a chance for growth.”
Target Audience: Who Are We Talking To?
You can’t do everything for everyone. A successful brand knows its audience like the back of its hand. This part is all about creating a clear image of your perfect customer.
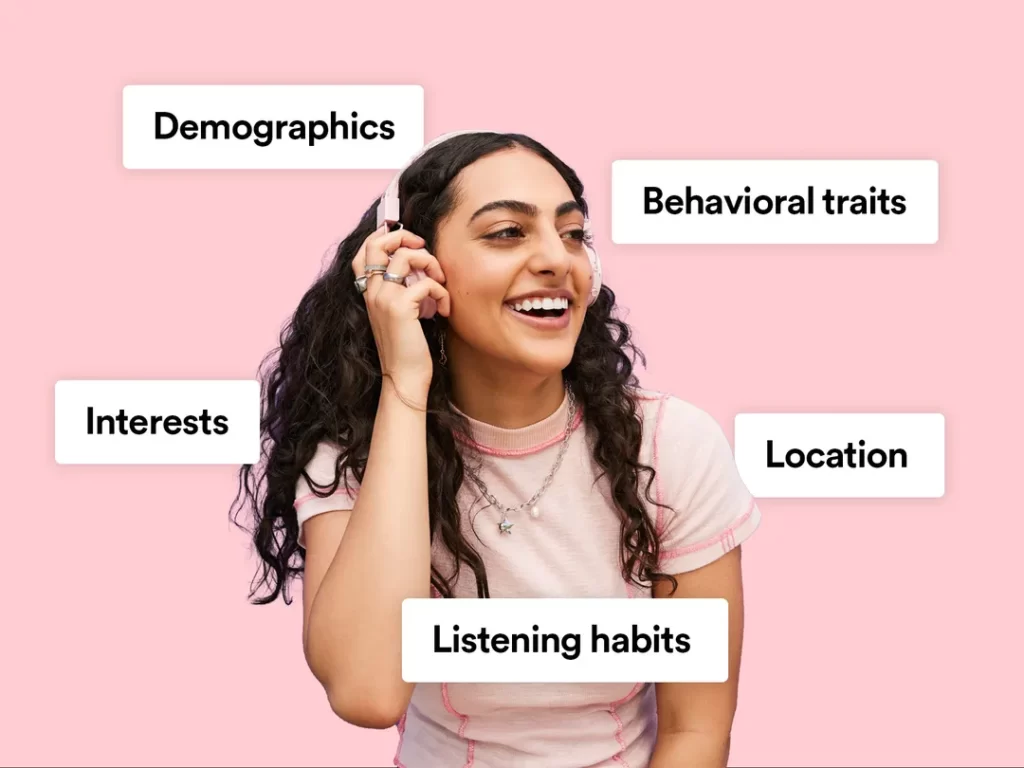
Segmentation Types and Data Sources
Start with segments, then write personas from them. Do not guess.
- Demographic and geographic census profiles, CRM profiles, store catchments.
- Psychographic, survey panels and brand trackers on attitudes and needs.
- Behavioural, POS or ecommerce data, web analytics, and email engagement.
- B2B firmographic, industry codes, company size, and tech stack from third-party data.
In our fieldwork, personas built from real segments produce cleaner media targeting and more stable conversion rates across quarters.
Buyer Personas
Build detailed profiles around your ideal customers. Give them names, faces, and backstories. For instance:
- Tech-Savvy Tina: 28-year-old urban professional, an early adopter of new technologies. Convenience and innovation are essential to her.
- Family-Focused Fred: 42-year-old suburban dad, safety and reliability come first, price-sensitive but willing to pay for quality
Customer Journey Mapping
Display how your brand connects with people’s lives. Map out the typical customer journey from awareness through purchase and beyond. Identify touchpoints where your brand can have an impact:
- Awareness: Social media ads, word-of-mouth
- Consideration: Website visits, product reviews
- Purchase: Online store checkout or physical retail transaction
- Post-purchase: Customer support centre call or loyalty program email
- Advocacy: Social media sharing or referral bonus redemption
Emotional Drivers
What drives them? Unpack the psychological and emotional forces behind their choices, such as:
- Aspirations – what are they trying to achieve?
- Fears – what do they worry about most?
- Values – which principles guide their decisions?
Understanding these drivers will enable you to create brands that resonate more deeply.
B2B vs B2C: Adjusting Your Strategy Presentation Logic
The way you present a brand for a Silicon Valley SaaS firm differs fundamentally from a boutique skincare label.
- B2C (Business-to-Consumer): Focus on Emotional Drivers. Use high-impact visuals, lifestyle imagery, and “vibe” slides. The goal is to evoke a feeling. Key metrics: Brand Recall, Sentiment, and Social Engagement.
- B2B (Business-to-Business): Focus on Firmographics and Trust. Use data, whitepapers, and logic-based positioning. The goal is to mitigate risk for the buyer. Key metrics: Cost Per Lead (CPL), Market Share, and Customer Lifetime Value (CLV).
Case Study: When Salesforce presents its brand, it focuses on “The Age of the Customer” and “Trust” as its primary differentiators in a crowded cloud market. Contrast this with Spotify, which focuses on “Personalised Discovery” and individual user joy.
Brand Positioning: Where Do We Want to Be?
Now that we perceive our place and know who our interlocutor is, let us clarify where we want to be. This is the core of branding strategy – your individuality within a market setting.
The Positioning Statement
Create an obvious statement which shows what your brand is all about. The traditional formula includes the following:
“For [target audience], [brand name] is the [category] that [key benefit] because [reason to believe].”For instance:
“For young professionals who value style and substance, TechChic is the smartphone brand that seamlessly blends cutting-edge technology with elegant design because we believe your device should be as sophisticated as yours.”
Brand Promise
What do you promise to provide customers with on each occasion? This might be:
- Quality: “Uncompromising excellence in every product”
- Innovation: “Always one step ahead of the curve”
- Experience: “Turning everyday moments into memories”
Your brand promise has to be ambitious but attainable; it must set a direction for all your branding activities, like a guiding light for ships at sea.
Differentiation factors
What sets you apart from competitors? Identify 3-5 points of differentiation between yourself and others around you (those whom they compete against). Some examples would include these:
- Unique technology
- Superior customer service
- Sustainable practices
- Personalisation options
Visually present these factors, maybe through bulleted lists or infographics – anything that clarifies what makes you unique.
Brand Architecture Choices
Brand architecture is how your brand portfolio is organised, from one masterbrand to many stand-alone brands.
It guides naming, visual systems, and investment. Pick a model that aligns with your growth plan, customer cognition, and risk profile, then document the decision rules for new offers.
- Branded House, one masterbrand spans products, efficient equity building.
- Endorsed Brands, product brands signposted by a parent, credibility plus flexibility.
- House of Brands, independent brands by category or segment, sharper positioning and risk separation.
Historical examples
- Virgin, a Branded House across travel, media, and finance with shared codes.
- FedEx, a Branded House with clear FedEx Express, Ground, and Freight naming.
- Marriott, an Endorsed system, Courtyard by Marriott, and Residence Inn by Marriott.
- Procter & Gamble, a House of Brands, includes Tide, Pampers, and Gillette across categories.
Future-Proofing with AI Brand Governance
A branding strategy presentation that ends with a PDF is doomed to fail. In 2026, you must present a plan for Automated Brand Governance.
Introduce the concept of a Digital Asset Management (DAM) system, such as Bynder or Adobe Experience Manager. These platforms allow your team to:
- Automate Consistency: Use AI to scan all outgoing marketing assets for brand compliance (colours, logo placement, tone).
- Centralise Truth: One source of truth for all logos, fonts, and templates.
- Real-time Tracking: See which assets are being used most frequently and where they might be drifting from the core guidelines.
By including a DAM implementation in your roadmap, you prove that the brand is a living system, not just a static set of slides.
Integrating ESG into Your Brand Narrative
Sustainability is no longer an extra; it is a core pillar of Brand Trust. When presenting your strategy, you must align your brand positioning with Environmental, Social, and Governance (ESG) commitments.
However, avoid “greenwashing”. Use the UN Sustainable Development Goals as a framework to anchor your claims. If your brand identifies as “Eco-Friendly”, your presentation must demonstrate:
- Supply Chain Transparency: Where and how products are made.
- Community Impact: Tangible contributions to social causes.
- Governance: Diversity in leadership and ethical business practices.
Example: Patagonia successfully presents its brand as an activist entity. Their “Don’t Buy This Jacket” campaign was a masterclass in aligning brand voice with radical sustainability, actually increasing long-term loyalty by sacrificing short-term sales.
Brand Elements: How Will We Get There?

Now that you know where to put yourselves, let’s bring your brand to life. This part focuses on what is perceivable by one’s senses and what is not.
Visual Identity
Frequently, people notice the visual identity first about a brand. It involves the following elements:
- Logo Design: You should consider showing variations and usage guidelines
- Colour palette: Make sure you explain the psychology behind your choices for colours
- Typography: Different fonts have different personalities, so use them to represent various aspects of your brand character
- Imagery style: Share sample photos or illustrations done in this manner, if any
Consider creating a mood board that showcases all the elements of your visual identity in one place.
Brand Voice
How does your brand sound? Establish what it says with these clear rules:
- Personality traits: friendly, authoritative, playful, etc.
- Language style: It can be simple vs technical or formal vs casual, among others
- Key phrases or buzzwords to use (and avoid)
Give examples of where and how it manifests in different contexts, e.g., social media posts with customer service scripts.
Brand Story
Behind every successful business lies an exciting story waiting to be told. Tell us more about yours through these points:
- Your origins – How did you come into existence?
- Your mission – What propels or motivates you?
- Your values – Which rules do you follow religiously?
You may present this information as a timeline or a series of critical milestones to make it more engaging.
Brand Experience
This encompasses customers’ interaction points with you at various levels; therefore,
- Website design and user experience should be top-notch always
- Never compromise on packaging and the unboxing experience, because they create lasting impressions, too!
- In-store or office environments must reflect who you are, so don’t overlook details!
- Social media presence plays a vital role in shaping perceptions of brands nowadays, underscoring the need for active account management.
- The customer service approach should always be warm and friendly
Use mock-ups or prototypes where necessary to illustrate these experiences during the presentation.
Implementation: Putting It All Together
Execution is the only thing that counts in a strategy. This part describes how you will roll out your new branding throughout the organisation.
Timeline
Give a timeline that can be implemented for your branding strategy. For instance:
- Internal launch and training (1 month)
- Soft launch to critical customers (2 months)
- Public rollout (3 months)
- Ongoing refinement and optimisation (ongoing)
Use a Gantt chart or another visual tool to indicate the schedule at a glance.
Resource Allocation
What will it take to make your branding strategy come alive? List down the necessary resources, such as:
- Budget: Design, production, marketing costs breakdown, etc.
- Team: Key roles and responsibilities should be identified
- Technology: Any new tools or platforms required should be highlighted
- Governance: stand up a Digital Asset Management system for master files and rights, define approvers and workflows, use version control and expiry dates, and publish channel-specific templates to reduce drift.
Be realistic about what is needed; requesting enough resources upfront is better than running short later.
Training and Integration
How can we ensure our staff are well-versed with this new brand identity? Think about:
- Brand guidelines document
- Training workshops for different departments
- Internal communication plan
- Brand champion program
We want every person within the firm to feel like they own this brand.
Metrics: How Will We Measure Success?

Any branding strategy that lacks a plan to measure its effectiveness is incomplete. This section describes the KPIs (key performance indicators) used to track progress.
Awareness of brand
How famous is your brand? You can follow these metrics:
- Spontaneous brand recall
- Engagement with social media mentions
- Search volume for terms related to the brand
Perception of brand
Do people see you as you want them to? Keep an eye on:
- Net Promoter Score (NPS)
- Associations with brand attributes
- Sentiment analysis in customer feedback
Standard definitions
Net Promoter Score, % of Promoters (9 to 10), minus % of Detractors (0 to 6), minus % of Passives (7 to 8), are excluded, Bain & Company.
Awareness splits into unaided, recalled without prompts, and aided, recognised from a list. Track both, then use brand lift pre- or post- or test versus control surveys to attribute changes to branding activity. Nielsen Norman Group on survey design principles.
Business Impact
Ultimately, your business results should be driven by your branding. Consider:
- Rates of customer acquisition and retention
- Average order value
- Market share
- Employee satisfaction and retention rates
These metrics should be presented in a dashboard format, with current baselines and future targets displayed.
Conclusion: The Power of a Strong Brand
Let’s step back and remember what brought us here as we finish.
An effective brand is not just about good-looking logos or catchy taglines; it is about establishing a deep relationship with your audience. It means having principles when everything else seems arbitrary and pointless. It is also about creating a heritage that will endure long after we’re gone.
We are not altering our external appearance or voice tone when implementing this branding strategy. We are fundamentally transforming ourselves as an organisation. This lays the foundation for future expansion, invention, and sustained achievement.
That said, are you prepared to bring your brand into new territories? Well, then buckle up because now is where it starts!
Let us leave our footprints all over Earth by differentiating each encounter people have with our brands one at a time!
10 Essential FAQs for Branding Presentations
How long should a branding strategy presentation be?
Aim for a 20-minute presentation, followed by 15-20 minutes of Q&A. This aligns with the “10/20/30 Rule” of presentations—10 slides, 20 minutes, 30-point font—though a strategy deck often requires the 12-slide master blueprint for full depth.
What is the “Share of Search” metric, and should I include it?
Yes. Share of Search is a powerful 2026 proxy for market share. It measures the volume of Google searches for your brand versus your competitors. Including this shows the board that your branding is driving real-world interest.
Should we present the “final” logo or multiple options?
Presenting one “hero” recommendation with 2-3 supporting “explorations” is best. It shows the rigour of your process while providing a clear point of view. Avoid “The Big Reveal” and instead take them on the journey of how you arrived at the solution.
How do we present a brand strategy for a global audience?
Focus on “Glocalisation”. Present a core global identity (the “Masterbrand”) while allowing for local flexibility in imagery and cultural nuance. Use a Brand Architecture slide to show how these sub-brands relate.
Is a SWOT analysis still relevant in 2026?
Yes, but it must be dynamic. Instead of a static 2×2, present a “TOWS” matrix that shows how you will use Strengths to exploit Opportunities and mitigate Threats.
How do I handle a stakeholder who hates the new brand colour?
Pivot from subjective “liking” to objective “functioning”. Use Colour Psychology and WCAG 2.2 accessibility data to explain why the colour was chosen (e.g., “This blue conveys trust and meets all international readability standards for our diverse user base”).
What is the difference between brand purpose and brand mission on a slide?
Purpose is the “Why” (Your reason for existing beyond profit). Mission is the “What” (What you do every day to achieve your vision). Present them together to show a unified front.
Do we need to mention AI in our branding presentation?
Only if it impacts the brand experience. If you are using AI for personalisation or customer service, explain how the Brand Voice will remain consistent across those automated touchpoints.
Should we include a “Competitor Brand Audit”?
Absolutely. Showing that you understand your rivals’ positioning better than they do builds massive credibility. Use a Perceptual Map to show the gap you intend to fill.
How often should we update this branding presentation?
The core strategy should be reviewed annually. However, your implementation roadmap and metrics slides should be updated quarterly to reflect market changes and brand performance.


This article perfectly captures the essence of crafting a powerful branding strategy. It’s not just about logos or catchy slogans; it’s about creating a narrative, making promises, and leaving lasting impressions. I appreciate the detailed approach, from understanding the significance of branding to breaking down the steps needed to build a compelling brand identity. The emphasis on knowing your audience, creating a cohesive visual identity, and measuring success through clear metrics is crucial for any business looking to stand out. For anyone serious about elevating their brand, these insights are invaluable. Thanks for sharing this comprehensive guide!