ESG Report Design: How to Build Credible, Clear Disclosures
Credible ESG report design makes evidence easier to inspect. It gives leadership a clearer publication process, helps stakeholders distinguish progress from aspiration, and reduces the chance that a polished presentation overstates what the data can support.



On this page8 min left
Effective ESG report design is not primarily about making sustainability disclosures look polished. It is about making claims, metrics, targets, assumptions, and limitations understandable without weakening their meaning.
For decision-makers, that distinction matters. A visually impressive report can still pose a risk if readers cannot identify the reporting boundary, source data, methodology, or evidence supporting a headline claim.
I recommend treating the report as a controlled disclosure system first and a communications asset second. The design should help investors, regulators, employees, clients, and other stakeholders move from a high-level message to supporting evidence without getting lost in dense technical content.
A strong report does three things at once:
- It gives senior readers a fast view of material ESG performance and strategic direction.
- It gives specialist readers traceable metrics, methodologies, and framework references.
- It gives the organisation a repeatable system for publishing consistent information across PDFs, web, presentations, and future ESG communications.
Build the Report Around Evidence
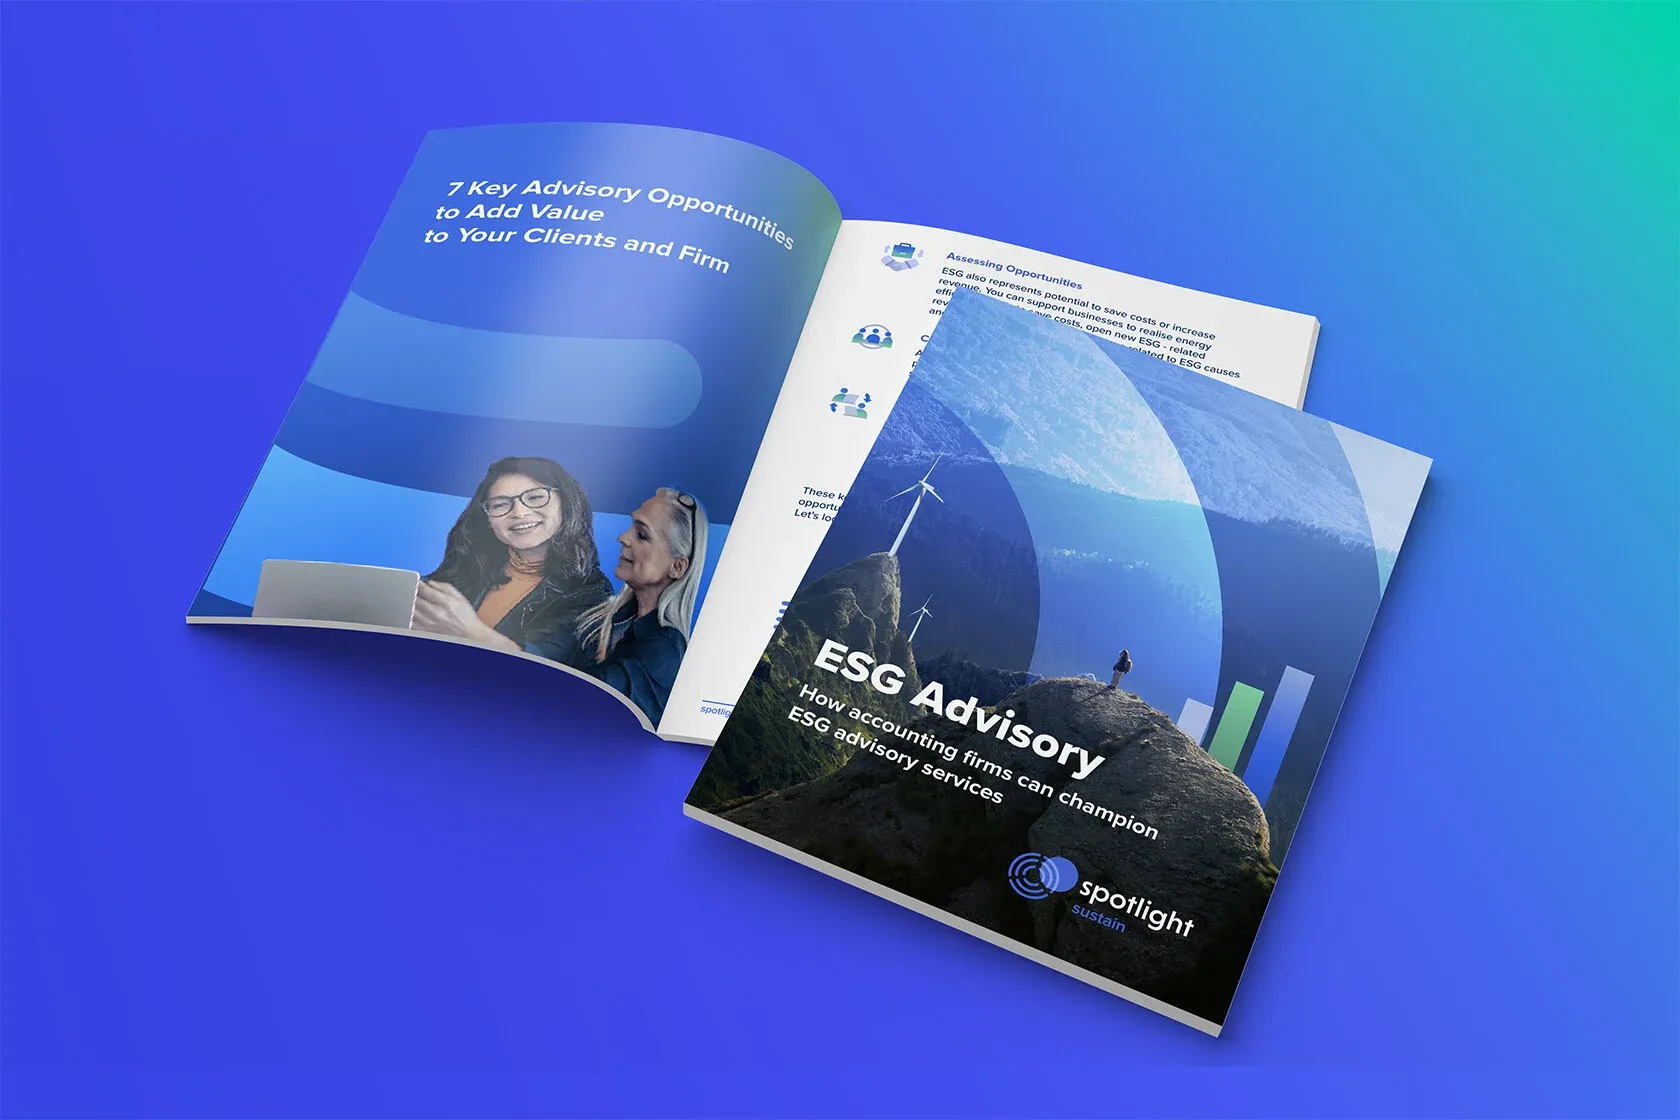
Start with disclosure architecture, not page concepts
The most reliable ESG reports begin with a disclosure architecture: a structured record connecting every published claim to its underlying evidence.
This is more rigorous than deciding that environmental performance belongs in one section, social performance in another, and governance in a separate section.
For every material statement, establish a traceable route from the page back to the underlying record. In practice, that record should identify the metric owner, source dataset, calculation method, reporting period, organisational boundary, assurance status, reviewer, and final approval.
Consider a headline such as: “We reduced operational emissions by 28%.”
The figure may be accurate, but a reader still needs to know whether it covers only Scope 1 and Scope 2 emissions, whether acquired businesses are included, which baseline year is used, and whether a change in methodology affected comparability.
Design cannot solve weak data governance, but it can prevent a well-supported number from becoming misleading through omission.
A practical disclosure register can include the following fields:
Field | Purpose in the design process | Reader value |
|---|---|---|
Claim or metric | Defines what will appear in the report | Makes publication scope clear |
Evidence source | Records the dataset, policy, or documented calculation | Supports provenance and review |
Reporting boundary | States entities, operations, or value chain activity included | Prevents false comparisons |
Methodology | Explains definitions, assumptions, and calculation rules | Helps specialists assess reliability |
Approval status | Confirms who reviewed the disclosure | Reduces late-stage publication risk |
This architecture also helps resolve a common production problem: the executive summary is often drafted before the evidence base is finalised.
If a key metric changes during review, the figure may be corrected in a data table but remain unchanged in the opening narrative, callout boxes, social assets, or web page. A controlled register makes those connected uses visible.
Use materiality to determine visual prominence
Materiality should influence not only what is reported, but also what receives visual emphasis. A topic that is significant to enterprise value, stakeholder impacts, or both should generally receive clearer explanation, stronger navigation, and more detailed evidence than a peripheral initiative.
That does not mean every material issue needs a full page of charts. It means the visual hierarchy should match the relevance of decisions.
A material workforce safety metric, for example, may justify a multi-year trend, performance commentary, target status, boundary definition, and a link to detailed tables.
A one-time volunteer event may warrant a brief factual mention, if it belongs in the report at all.
Use this test before giving a story, image, or data visualisation prominent space:
- Does it explain a material impact, risk, opportunity, target, or governance decision?
- Can the claim be supported by evidence that is available to reviewers?
- Does the visual treatment reflect the scale and certainty of the result?
- Would removing the item make it harder for a stakeholder to assess performance?
If the answer to the final question is no, the content may be decorative sustainability storytelling rather than decision-useful disclosure.
That does not automatically make it inappropriate. It does mean it should not crowd out comparable metrics, limitations, or unresolved risks.
Separate the narrative layer from the data layer
Dense ESG reporting creates a real tension: a report that reads like a technical manual may lose non-specialist readers, while an overly simplified report can conceal the detail needed for scrutiny. The answer is not to choose one audience over another. It is to use progressive disclosure.
The first layer should state the issue, performance direction, and strategic relevance in plain language. The next layer should provide the evidence: charts, tables, target definitions, methodology notes, and framework references. Technical detail can then sit in appendices, downloadable data packs, or linked web content.
This is especially useful for professional services firms. An advisory business may have relatively limited direct operational emissions but meaningful considerations in people, governance, data security, procurement, and client service.
The report should make those priorities explicit rather than borrowing an industrial reporting structure that overweights topics with limited relevance.
A disciplined approach to ESG visual governance helps ensure that recurring icons, diagrams, charts, and summary statements remain connected to approved disclosures rather than becoming separate marketing assets with different claims.
Design for Decisions, Accessibility, and Credibility
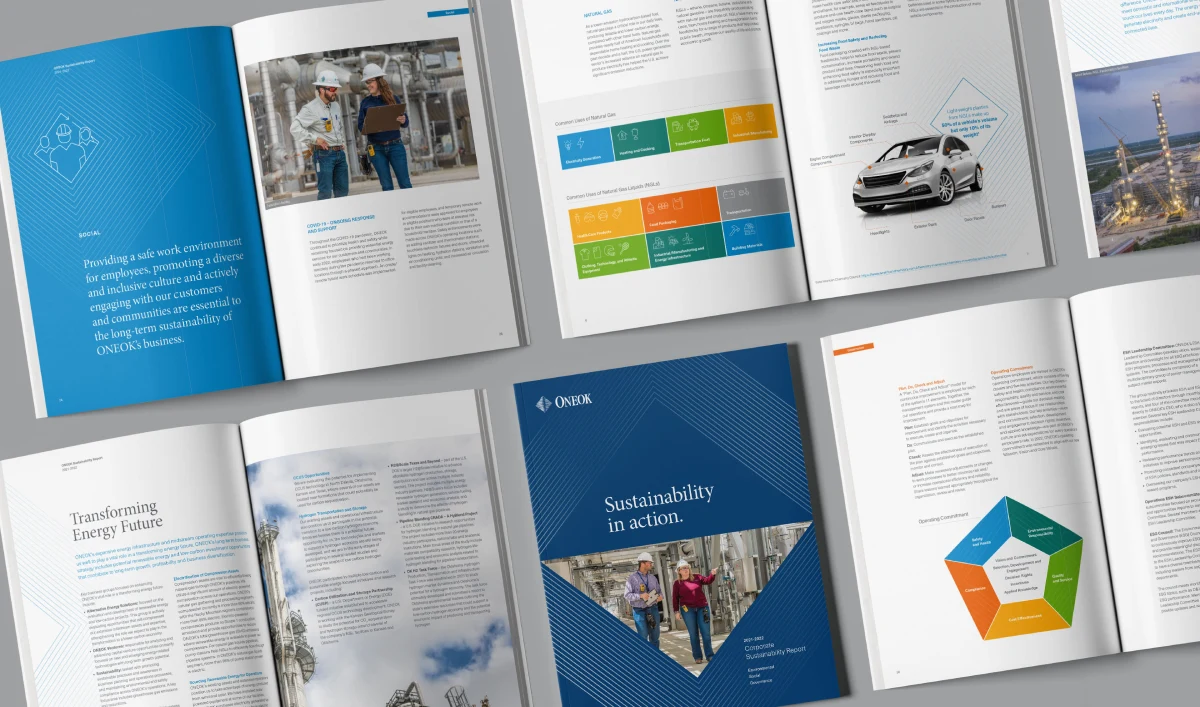
Choose charts based on the decision, not the dataset
A chart should answer a specific question. If it does not, use a table or remove it. The available data format should not dictate the visual format.
Reader question | Suitable format | Avoid when |
|---|---|---|
Are we improving over time? | Line chart with baseline and target | Periods use different methodologies without explanation |
Are we on track against a target? | Bullet chart or annotated progress bar | The target has changed or lacks a defined deadline |
Which areas contribute most? | Ranked bar chart | Categories overlap or do not share the same unit |
What changed from one year to another? | Waterfall chart | The component changes cannot be reconciled |
What are the exact figures? | Accessible table | A visual summary would hide important precision |
For example, a line chart can show declining greenhouse gas emissions, but it can also overstate progress if the reporting boundary narrowed during the period.
In that case, the chart needs a visible marker for the boundary change, a restated comparative figure where available, or a clear note that the trend is not directly comparable.
Do not hide uncertainty in the footnotes. Estimates, confidence indicators, methodology changes, and restatements deserve a consistent visual language.
A subtle symbol next to an estimated metric, supported by a plain language note, is usually more useful than a long disclaimer placed several pages away.
Make accessibility part of the design system
Accessibility cannot be added successfully during the final PDF export. It must be built into layouts, components, copy, and digital interactions from the beginning.
A usable ESG report should account for the following:
- Colour should reinforce meaning, not be the only way a reader identifies status, category, or change.
- Charts should have descriptive titles that state the finding, not merely the metric name.
- Complex charts should include accessible data tables or equivalent text summaries.
- PDFs should use tagged structure, logical reading order, headings, and meaningful link text.
- Interactive reports should support keyboard navigation and avoid controls that require a mouse or hover action.
- Typography should maintain readable size, contrast, line spacing, and hierarchy across screen and print formats.
Brand typography is therefore more than a visual identity choice. In an ESG report, type styles need to distinguish narrative, metrics, footnotes, methodology, tables, and framework indices without making small essential text difficult to read.
Accessibility also strengthens credibility. If a report presents a strong climate target in large type but places its boundary, exclusions, and calculation basis in low-contrast text, the document may technically contain the detail while functionally obscuring it. Readers notice that imbalance.
Apply a claim-to-proof review before publication
A final claim-to-proof review is a practical safeguard against overstatement. It examines whether the wording, visual emphasis, evidence, and caveats are proportionate.
Use the review for headlines, target statements, opening letters, case studies, photography captions, and major charts. Ask four questions:
- What exactly is the claim?
- What evidence supports it, and who approved that evidence?
- What limitation, exception, or boundary could change the reader’s interpretation?
- Does the visual treatment make the claim appear broader, more certain, or more material than the evidence permits?
A good test case is a feature spread showing renewable electricity procurement. If the claim relates only to specified offices or a particular reporting year, the image and headline should not imply that all operations are powered by renewable electricity.
The correction is not necessarily a larger disclaimer. Often, it is a more precise headline and a nearby scope statement.
This review should also assess brand expression. Clear Brand guidelines can create a coherent visual system, but heavy use of campaign imagery, celebratory language, or oversized decorative graphics may weaken the perceived seriousness of governance disclosures and data limitations.
Control Formats, Frameworks, and Publication Changes
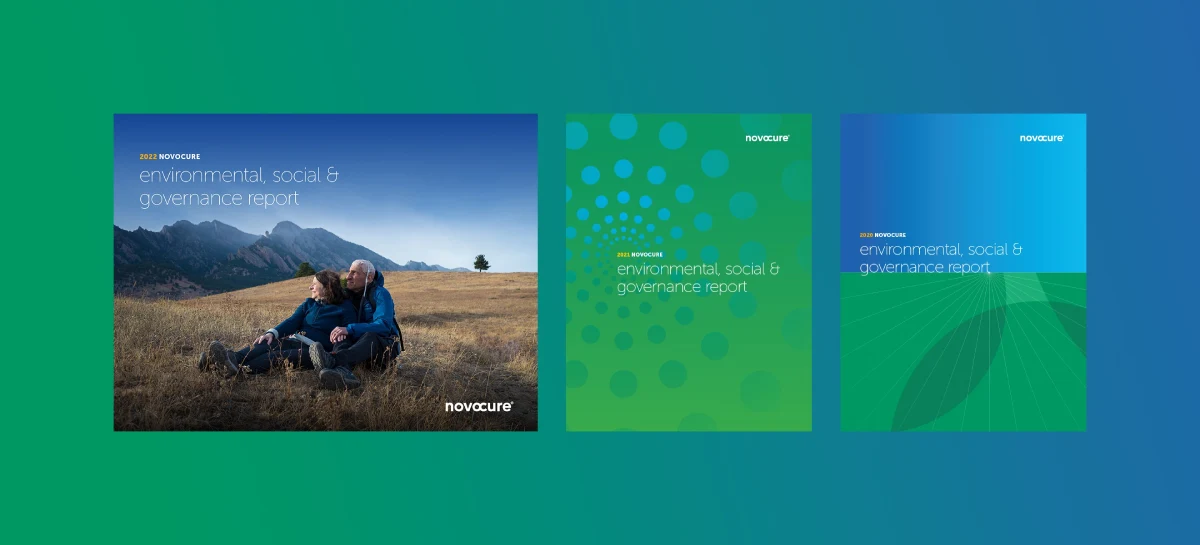
Decide what belongs in PDF, web, and data packs
There is no universal best format for ESG reporting. The right choice depends on stakeholder needs, update frequency, regulatory expectations, and the organization’s ability to maintain controlled versions.
Format | Best use | Main strength | Main control risk |
|---|---|---|---|
PDF report | Formal annual publication and archival record | Stable, printable, shareable | Poor navigation or inaccessible export |
Web report | Ongoing discovery and layered explanation | Searchable and easier to update | Figures can drift from the published PDF |
Interactive report | Filters, linked content, and deeper exploration | Supports progressive disclosure | Complex accessibility and version control |
Data pack | Detailed metrics and calculations | Enables analyst scrutiny | Can become disconnected from narrative context |
For many organisations, a controlled PDF and a web version are complementary. The PDF acts as the fixed reporting record. The website can make content easier to find, add explanatory layers, and direct readers to related policies or data files.
The risk is publication drift. A late correction to a workforce metric might appear on the website but not in the PDF, or vice versa.
Treat identical metrics in different formats as a controlled publication problem. Maintain an approved figure library, shared chart specifications, and a record of where each metric appears.
Shared chart styles and approved figures can help maintain consistency between web and PDF versions; that principle is useful because format consistency depends on operational control, not visual similarity alone.
Build framework crosswalks that readers can use
A report may need to address GRI Standards, SASB Standards, TCFD recommendations, ISSB Standards, or jurisdiction-specific requirements.
Framework compliance can make reports technically dense, yet hiding it in an appendix can frustrate readers who need to verify disclosures.
Use a framework index as a bridge, not a dumping ground. The main report should explain material topics in a coherent business narrative. The index should map each framework requirement to page numbers, relevant sections, and, where useful, external documents or data tables.
A usable crosswalk typically includes:
- The framework and disclosure reference.
- The report location.
- A concise disclosure title.
- Any reason a requirement is not applicable, omitted, or addressed elsewhere.
Akendi observes that ESG report design must make complex sustainability information accessible while accommodating the requirements of reporting frameworks.
The practical implication is that framework content needs its own information architecture, rather than being forced into the main narrative page by page.
Design the report as a reusable communications system
A well-governed report can supply the approved foundations for investor presentations, recruitment communications, client questionnaires, policy summaries, and web updates.
This does not mean copying report pages into every channel. It means establishing reusable components: metric definitions, chart rules, approved claims, source notes, icons, and accessibility patterns.
Teneo has noted that sustainability report design is increasingly treated as a flexible toolkit for later ESG communications. That can create efficiency, but only if reuse remains controlled.
A chart made for an annual report may need updating, rescoping, or reapproval before it appears in a new business development context.
Digital reports also need navigation that respects reader behaviour. Armanino identifies repeated headers and links to major report sections as useful navigation features in digital ESG reports.
Use these features to reduce friction, but do not let interaction replace basic document structure.
A reader should still be able to understand a page when it is printed, shared as a screenshot, or opened from a direct link.
Conclusion
Credible ESG report design makes evidence easier to inspect. It gives leadership a clearer publication process, helps stakeholders distinguish progress from aspiration, and reduces the chance that a polished presentation overstates what the data can support.
Start with traceable disclosures, design for layered reading, make limitations visible, and control every published version. The result is not simply a better-looking sustainability report. It is a more defensible corporate communication asset.
Questions people ask
What is ESG report design?
ESG report design is the process of organising and presenting environmental, social, and governance disclosures so readers can understand performance, targets, methodology, risk, and accountability. It includes information architecture, visual hierarchy, data visualisation, accessibility, framework mapping, and publication controls.
What should an ESG report contain?
The content depends on material topics and applicable reporting requirements, but most reports need governance information, materiality context, targets, performance metrics, methodology notes, reporting boundaries, risk discussion, and a framework index. Include an assurance statement where relevant, and distinguish assured metrics from unassured narrative or estimates.
How is ESG report design different from annual report design?
Annual report design often centres on financial performance, statutory reporting, and corporate governance. ESG report design must also explain nonfinancial metrics, evolving methodologies, value chain boundaries, and sustainability-related impacts or risks. It may need deeper data provenance and more visible caveats because comparability can be less straightforward.
Which charts work best for ESG targets and performance trends?
Use a line chart for comparable multi-year trends, a bullet chart for progress toward a defined target, and a table where exact values matter. Avoid a chart when a changed reporting boundary or methodology makes the trend hard to interpret. In that situation, show restated data where possible or explain why direct comparison is limited.
Should an ESG report be a PDF, a website, or both?
For many organisations, both formats are appropriate. Use a PDF as a stable annual record and a website for easier discovery and layered content. Choose one format only when the organisation cannot reliably keep figures, definitions, and updates consistent across two publications.
How should methodology notes and data limitations appear in the design?
Place the most decision-relevant limitations close to the related claim or chart. Use links, footnotes, appendices, and data packs for full technical detail. Do not rely on a distant methodology section to correct an oversized headline or ambiguous visual.
What accessibility requirements should ESG charts and PDFs meet?
Charts should not rely on colour alone and should provide descriptive titles, text summaries, and accessible data where necessary. PDFs should be tagged, follow a logical reading order, and include meaningful headings and links. Interactive versions should support keyboard use and readable contrast.