7 Customer Experience Metrics to Stop Guessing & Start Growing
Most businesses are drowning in data but absolutely starved for wisdom.
You’ve got dashboards, analytics, spreadsheets, and charts coming out of your ears. They show website clicks, social media followers, and open rates. It all looks very impressive.
And it’s mostly useless.
This is the trap of Data Paralysis. It’s the state of collecting endless information that tells you what’s happening but gives you zero clue why. It makes you feel busy, but you’re not getting any better. You’re just admiring the scenery on the road to irrelevance.
The cure is Actionable Insight. It’s about finding the few, powerful signals that tell you the unvarnished truth about your customers’ experience. A good metric doesn’t just sit in a report; it grabs you by the collar and forces you to do something.
This isn’t an academic exercise. This is about survival. Forget the corporate jargon and the complicated software. Here are seven customer experience metrics you can start tracking today to build a business people want to return to.
- Data Paralysis hinders businesses; actionable insights on customer experience metrics drive meaningful improvements and successful strategies.
- Focus on critical customer experience metrics like NPS, CSAT, and CES for actionable insights that influence retention and loyalty.
- Collect qualitative feedback regularly to uncover deeper insights; numbers show what is happening, while words explain why.
Why You’re Probably Measuring the Wrong Things
Most small business owners track vanity metrics. These numbers are easy to measure and look good on a chart, but they don’t predict revenue or customer loyalty.
A thousand new Instagram followers don’t pay the bills. A spike in website traffic means nothing if every one of those visitors leaves in frustration.
Customer experience (CX) metrics are different. They measure the quality of the relationship you have with your customers. They tell you that people feel respected, understood, and valued. They are the leading indicators of your business’s health.
The rule is simple: a good metric makes you act. If you can look at a number and not precisely what to do next, you’re measuring incorrectly.
The Ten Principles Behind Great Customer Experiences
Matt Watkinson’s The Ten Principles Behind Great Customer Experiences cuts through the noise with practical, psychology-driven ideas. It’s simple, actionable, and universally applicable—whether you’re a CEO or just starting out. No jargon, no BS, just tools to actually improve customer experiences fast.
As an Amazon Partner, when you buy through our links, we may earn a commission.
The 7 Customer Experience Metrics Worth Your Time
Forget the endless lists of KPIs you find online. For most small businesses, you only need to get a handle on a select few. Start here. Master these, and you’ll know more about your customers than 90% of your competitors.
1. Net Promoter Score (NPS): The “Would You Recommend Us?” Metric
What It Is Net Promoter Score, or NPS, is a metric that measures customer loyalty by asking one simple question: “On a scale of 0-10, how likely are you to recommend our business to a friend or colleague?
Why It Matters (Beyond the Hype) This is the metric every “thought leader” loves; they often treat it like a holy grail. It isn’t. Its real power isn’t the final score; it’s in how it segments your customers into three distinct groups:
- Promoters (9-10): These are your loyal fans. They are repeat buyers and your best source of word-of-mouth marketing.
- Passives (7-8): They’re satisfied but not enthusiastic. They’re vulnerable to offers from your competitors.
- Detractors (0-6): These are unhappy customers. They are at risk of churning and can damage your brand through negative reviews.
Seeing these three groups clearly gives you an immediate action plan.
How to Measure It: To calculate your NPS, you survey your customers and then apply this formula:
NPS = % Promoters – % Detractors
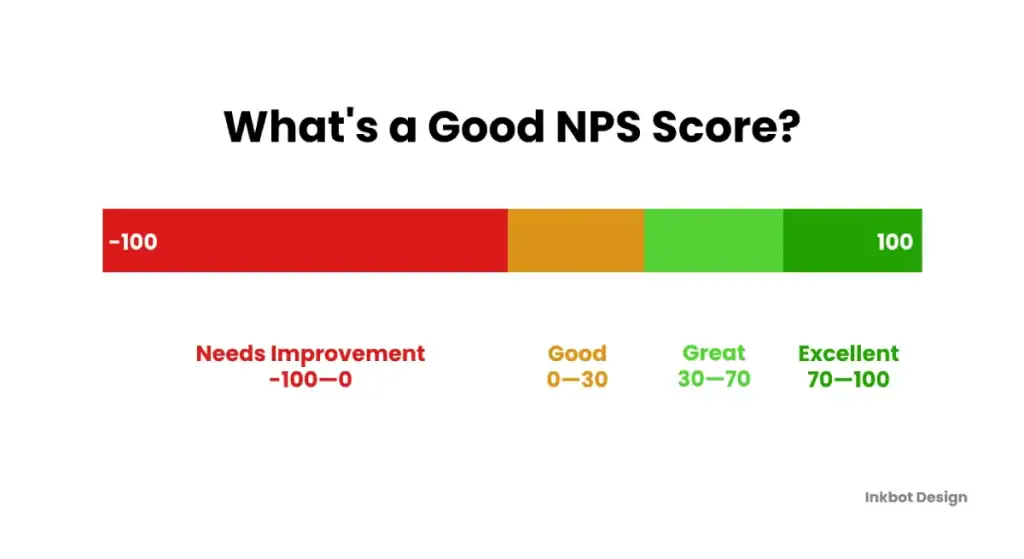
The result is a score ranging from -100 (if everyone is a detractor) to +100 (if everyone is a promoter).
What to Do with It: The score itself is just a benchmark. The work starts after you get it.
- For Promoters: Follow up immediately. Ask them why they gave you a 9 or 10. Their answer is your marketing copy. Then, ask for a testimonial or a review.
- For Detractors: This is a fire alarm. Contact them personally within 24 hours. Don’t be defensive. Ask, “What did we do wrong, and how can we do it?” You might not save the customer, but you’ll learn exactly where your experience is broken.
Ignoring the “why” behind the score is the biggest mistake people make with NPS. A number is a symptom; the reason is the cure.
2. Customer Satisfaction (CSAT): The “In-the-Moment” Check-in
What It Is: A Customer Satisfaction score measures customers’ feelings about a specific interaction. It’s a snapshot of their happiness at a single touchpoint, like after a support call, a delivery, or using a feature for the first time.
While NPS measures long-term loyalty, CSAT gives you a granular, real-time view of your operations. It helps you pinpoint the exact moments in your customer journey that are causing frustration or creating delight.
Is your new checkout process confusing? Is one of your support agents a superstar? CSAT will tell you. Amazon’s simple star-rating system after a purchase is a perfect example of a low-friction CSAT survey.
How to Measure It It’s typically a simple question: “How satisfied were you with your [interaction] today?”
The answer is usually on a 1-5 scale, or with simple emojis (😡, 😑, 😊). The score is the percentage of customers who are “satisfied” (e.g., chose 4 or 5).
CSAT Score = (Number of Satisfied Customers / Number of Survey Responses) x 100
What to Do with It: Look for patterns. If your post-delivery CSAT is consistently low, you don’t have a product problem; you have a logistics problem. If your support chat CSAT is high but your phone support CSAT is low, you know where to invest in training. CSAT allows you to perform surgical improvements instead of guessing.
3. Customer Effort Score (CES): The “How Easy Was That?” Metric

What It Is: Customer Effort Score measures how much work a customer had to put in to get something done. This could be purchasing, finding an answer, or resolving an issue.
Why It Matters: In the modern economy, the greatest currency is convenience. People will pay more for an easier experience. Forcing your customers to jump through hoops is the fastest way to send them to a competitor. High effort kills loyalty.
Think about a brand like Monzo Bank. Their entire app is built to minimise taps and confusion. That obsession with effortlessness is why they have such a fanatical user base.
How to Measure It. After an interaction, you ask the customer to agree or disagree with a simple statement:
“[Company] made it easy for me to handle my issue.”
They respond on a 7-point scale from “Strongly Disagree” to “Strongly Agree.”
What to Do with It: Your goal is to make your score as high as possible. If customers report high effort, you need to dig in. Map out the process they’re complaining about, step by step. Where are the dead ends? Where is the confusing language? Your job is to eliminate friction from every interaction ruthlessly.
4. Customer Churn Rate: The “Leaky Bucket” Metric
What It Is: Churn Rate is the percentage of customers who cut ties with your company during a specific period. It’s the ultimate metric for failure.
Why It Matters: Churn is the silent killer of growth. You can spend a fortune on marketing to bring new customers in the front door, but you’re just running in place if your existing customers are constantly fleeing out the back.
It costs 5 to 25 times more to acquire a new customer than to retain an existing one. A high churn rate is a blaring siren that your customer experience has fundamental flaws. It’s what put Blockbuster out of business and what Netflix obsesses over daily.
How to Measure It The calculation is straightforward for a given period (like a month or quarter):
Churn Rate = (Customers Lost in Period / Customers at Start of Period) x 100
What to Do with It First, measure it. Religiously. Second, when a customer churns, conduct an exit interview. An automated email is fine, but a phone call is better. Ask why they left. Look for patterns in the answers. Are they all going after their first three months? Is a specific missing feature the cause? High churn directly results from a poor experience or a failure to deliver on your brand promise.
5. Customer Lifetime Value (CLV): The “Are We Building Relationships?” Metric

What It Is: Customer Lifetime Value is a forecast of the total amount of money you can expect from a single customer over their relationship with your business.
Why It Matters CLV forces you to stop thinking about single transactions and start thinking about long-term relationships, when you know a customer could be worth £2,000 over the next five years, you’re more willing to spend £50 to solve their problem today.
Brands like Starbucks have mastered this. Their loyalty app isn’t just about giving away free coffee; it’s an engine designed to maximise the CLV of everyone who walks through their door.
How to Measure It (Simply) You don’t need a data scientist. A simple formula will get you started:
CLV = (Average Purchase Value) x (Average Purchase Frequency) x (Average Customer Lifespan)
For example, A customer spends an average of £50 per visit, visits 4 times a year, and stays with you for 3 years. Their CLV is £50 * 4 * 3 = £600.
What to Do with It: A great customer experience is the most effective way to increase CLV. When you make people feel good, they buy more often and stick around longer. This metric helps you justify investments in service and quality. It also shows that your digital marketing efforts should be just as focused on retention as on acquisition.
6. Average Resolution Time: The “Stop Wasting My Time” Metric
What It Is: This is the average time it takes for your team to completely resolve a customer’s issue or ticket, from the moment they first make contact. “Closed” doesn’t mean you replied; it means the customer’s problem is solved.
Why It Matters: Nothing destroys trust faster than delay and incompetence. When a customer has a problem, they are stressed. Your ability to resolve that problem quickly and effectively is a defining moment in their experience.
Think of a good local plumber. Their value isn’t just that they fix the leak and show up on time and get it done fast. Speed is a feature.
How to Measure It. This one is simple maths for your support tickets over a period:
Average Resolution Time = Total Time to Resolve All Tickets / Number of Tickets
What to Do with It. Your only goal is to drive this number down. Analyse the tickets that take the longest. Is there a recurring product flaw you need to fix? Does your team need more training on a specific type of issue? Reducing resolution time often means improving your internal processes, which pays dividends everywhere.
7. Qualitative Feedback: The “Metric That Isn’t a Number”

What It Is This is the most important “metric” on the list and isn’t even a number. It’s the raw, unfiltered, verbatim feedback your customers give you in survey comment boxes, online reviews, social media posts, and support emails.
Why It Matters The numbers tell you what is happening. The words tell you why. The “why” is where you find your most significant opportunities for improvement and innovation. Obsessing over a 4.2 versus a 4.3 rating while ignoring the written comments is a classic rookie mistake. The real gold is in the story.
A brand like BrewDog built its rebellious identity on listening to and directly engaging with this kind of feedback on social media. It makes customers feel like they are part of the brand, not just consumers of it.
How to Measure It You don’t calculate qualitative feedback; you consume it. Create a system to gather it all in one place. Read it every single week. No exceptions.
What to Do with It: Read it. Tally the recurring themes. If ten people mention your clunky packaging this month, fix the packaging. If five people praise a specific employee, give that person a bonus. Most importantly, close the loop. When you make a change based on feedback, tell the customers who suggested it. Nothing creates a loyal advocate faster than being heard.
How to Choose the Right Metrics for Your Business
Don’t try to implement all seven of these at once. You’ll just end up back in Data Paralysis.
Start with one or two that address your biggest known problem.
- If you’re worried about customer retention, start with Churn Rate.
- If you feel like your support team is overwhelmed, start with Average Resolution Time.
- If you just want a general health check, start with NPS.
The key is to connect your measurement to a specific business goal.
And please, stop using the “survey fatigue” excuse. Customers aren’t tired of surveys; they’re tired of selfish surveys that ask 20 questions and offer nothing in return. Keep your surveys short (one or two questions), send them immediately, and prove you’re listening by acting on the feedback. It’s a value exchange, not an interrogation.
The Real Goal: From Metrics to Momentum
Tracking these metrics isn’t the goal. The goal is to build a better business. The numbers are just the tools that show you where to focus your effort.
They provide the clarity you need to stop guessing and make intentional improvements that your customers will notice and reward you for.
A powerful brand isn’t just about having a clever logo or a slick website from a place like Inkbot Design. It’s the sum of a thousand small, positive experiences. These metrics are your guide to creating those experiences, one interaction at a time.
If you’re ready to stop guessing and start building a more customer-focused brand but aren’t sure where to start, getting some expert advice can make all the difference. You can always request a quote to see how a professional perspective can clarify your strategy.
Frequently Asked Questions about Customer Experience Metrics
What’s the difference between a CX metric and a KPI?
A Key Performance Indicator (KPI) is a broad term for any performance measure. A CX metric is a specific type of KPI focusing exclusively on measuring the customer’s perception and experience with your company. All CX metrics are KPIs, but not all KPIs are CX metrics.
How often should I measure these metrics?
It depends on the metric. Transactional metrics like CSAT and CES should be measured in real-time, immediately after an interaction. Relational metrics like NPS are best measured quarterly or semi-annually to track trends. Churn and Resolution Time should be monitored constantly, usually on a monthly dashboard.
What metric should I start with if I can only pick one?
Start with NPS, but with a mandatory open-ended “Why?” question. It gives you both a high-level benchmark (the score) and specific, actionable feedback (the comments) from your most and least happy customers.
Can I measure customer experience without sending surveys?
Yes, partially. You can track behavioural metrics like Churn Rate, repeat purchase rate, and CLV. You can also monitor qualitative feedback from online reviews and social media. However, you need to ask your customers directly to get direct metrics like NPS, CSAT, and CES.
Is a “good” NPS score different for every industry?
Absolutely. An NPS of +30 might be excellent for a telecommunications company but poor for a high-end retailer. It’s more important to focus on improving your score over time than to compare it obsessively to industry benchmarks you can’t verify.
What is the biggest mistake businesses make with CX metrics?
The biggest mistake is failing to act on the data. They collect the scores, put them in a report, and do nothing. The entire purpose of these metrics is to identify problems and opportunities so you can improve the customer experience. Data without action is just trivia.
How can I increase my survey response rates?
Keep it short (1-2 questions).
Send it at the right time (immediately after the interaction).
Explain why you’re asking and what you’ll do with the information.
Occasionally, close the loop and show customers the changes you’ve made based on their feedback.
What’s the difference between CSAT and CES?
CSAT measures satisfaction, which is an emotional response. CES measures ease, which is a practical assessment of effort. Research suggests that reducing effort (improving CES) is often a better predictor of future loyalty than simply increasing satisfaction.
How does my website’s user experience (UX) relate to these metrics?
Website UX is a massive component of the overall customer experience. A confusing, slow, or difficult-to-navigate website will lead to high customer effort (bad CES), low satisfaction (bad CSAT), and could ultimately contribute to customer churn.
Should I share these metrics with my entire team?
Yes. Everyone in your company should understand how their role impacts the customer experience. Sharing these metrics helps create a customer-centric culture where everyone feels responsible for making customers happy, not just the “customer service” department.