
How to Create Social Media Graphics Using One Stupid-Simple Rule
Most people overthink social media graphics and waste hours trying to create something “perfect.” I’ve analysed thousands of high-performing posts across platforms. I will share the one principle separating winners from losers in the social media design game.
- Make it instantly valuable within three seconds via education, entertainment or emotion; everything else is secondary.
- Design mobile-first and platform-specific: use recommended aspect ratios, test crop previews, and ensure text readability at small sizes.
- Prioritise clear visual hierarchy: one focal point, minimal text, strong contrast, directional cues and negative space to guide attention quickly.
- Build templates and systems, keep brand consistency, A/B test designs and track engagement metrics to refine what actually works.
The One Stupid-Simple Rule for Social Media Graphics
Here it is: Make it instantly valuable.
That’s it. Every successful social media graphic delivers immediate value to the viewer within 3 seconds. The value must be instilled through education, entertainment, or emotional connection.
Everything else is secondary.
When your social media graphics provide instant value, engagement rises dramatically. I’ve seen this pattern repeatedly while working with brands generating millions in revenue through social platforms.
Why Most Social Media Designs Fail
Before diving deeper, let’s examine why so many social media graphics underperform:
- They focus on looking pretty instead of conveying value
- They try to say too much in one image
- They lack a visual hierarchy that guides the eye
- They ignore platform-specific requirements
- They don’t align with the brand’s overall visual identity
The average person scrolls through 300 feet of social media content daily. Your graphic has about 1.7 seconds to grab attention before it’s lost forever.
Platform-Specific Design Requirements
Let’s break down how to apply our stupid-simple rule across different platforms:
Instagram Graphics That Convert
Instagram feed posts in 2026 are being discussed in two vertical formats: 4:5 at 1080 × 1350 and the newer 3:4 at 1080 × 1440.
Personally, I think 3:4 is the best option because it uses more vertical space, even though others still recommend 4:5 because it remains the most established, broadly supported, and less likely to be awkwardly handled in previews or templates.
Our practical advice
- Use 1080 × 1440 px (3:4) if you want the most current, tallest feed format and you’re comfortable designing for a newer standard.
- Use 1080 × 1350 px (4:5) if you want the safest all-round default for feed posts and carousels.
- Keep 1080 × 1080 px as a secondary square option for brand systems that rely on symmetry.
Facebook Post Design That Stops the Scroll
Facebook’s algorithm rewards posts that generate meaningful interactions, so your graphics should spark conversation.
For Facebook:
- Use 1080 × 1080 px (1:1) for versatile feed posts.
- Use 1080 × 1350 px (4:5) for taller, mobile-first graphics that stop the scroll.
- Use 1200 × 628 px (1.91:1) for link previews and landscape-style content.
- Include faces when possible, as people-centred visuals tend to perform better.
- Keep text minimal and make the question or idea obvious at a glance.
- Use bright, contrasting colours that stand out in a crowded feed.
One of my clients increased their Facebook engagement by 217% simply by reformatting their graphics to ask questions visually rather than make statements.
X (Twitter) Graphics that Stop the Scroll
On X, your graphics compete in a text-heavy environment. Make them count.
For X posts and timeline images:
- Use 1200 × 675 px (16:9) for optimal landscape format, fully displayed without cropping on most devices.
- 1080 × 1080 px (1:1) works reliably as a square alternative for balanced, mobile-friendly visuals.
- 1080 × 1350 px (4:5) is increasingly supported for taller graphics that grab more vertical attention.
- Create simple, bold visuals with minimal text – aim for instant readability.
- Use strong colour contrast and clean typography to stand out.
- Include your handle or logo subtly to boost brand recall.
- You can add up to 4 images per post, or 1 video/GIF (up to 512MB, 2:20 max length).
- Always add alt text (up to 1000 characters) for accessibility, SEO, and screen readers.
- X users engage mostly on mobile while multitasking, so test at small sizes—your message must land in 1-2 seconds.
LinkedIn Post Visuals for Professionals
LinkedIn is where professionals go to learn and network. Your graphics should reflect this business-minded environment.
For LinkedIn feed posts:
- Use 1200 × 627 px (1.91:1) for single images – the best landscape format for full News Feed visibility without cropping.
- 1080 × 1080 px (1:1) square works reliably for balanced, mobile-optimised designs.
- 1080 × 1350 px (4:5) portrait is gaining traction for taller, scroll-stopping graphics.
For carousel/document posts:
- Upload multi-page PDFs (up to 100MB, 300 pages) which render as native carousels.
- Design each page at 1080 × 1350 px (4:5) vertical with clear headings, large type (min 24pt), and minimal text per slide.
- Export as high-res PDF to avoid compression – LinkedIn handles this better than image carousels.
Best practices:
- Prioritise data visualisations, charts, and infographics – they outperform stock photos.
- Stick to professional colour palettes (blues, greys, subtle accents).
- Include your headshot or logo subtly for personal/brand authority.
- Custom graphics boost comments by 98% and shares by 54% vs. stock or no images.
I’ve found that LinkedIn posts with custom graphics receive 98% more comments and 54% more shares than those with stock images or no images at all.
The Science Behind High-Performing Social Media Graphics

The psychology of visual content is fascinating. Our brains process images 60,000 times faster than text. When we see a powerful social media graphic, these things happen:
- Visual processing occurs in 13 milliseconds
- Emotional response triggers in under half a second
- The decision to engage happens within 3-5 seconds
This is why applying our stupid-simple rule (making it instantly valuable) works so well—it aligns perfectly with how our brains are wired.
Practical Design Tools for Non-Designers
Not everyone is a design wizard, and that’s OK. These tools make creating valuable social media graphics accessible to anyone:
Canva Templates That Convert
Canva has revolutionised design for non-designers. The key is not just using Canva, but using it effectively:
- Start with templates optimised for your specific platform
- Customise with your brand colours and fonts
- Maintain visual consistency across all posts
- Use the magic resize feature to adapt to different platforms
The most effective Canva users create a “template system” rather than designing one-off graphics. This ensures brand consistency while saving hours of design time.
Mobile-First Design Approach
Over 80% of social media consumption happens on mobile devices. This has massive implications for your graphic design:
- Test all graphics on mobile before posting
- Ensure text is readable on small screens (16pt minimum)
- Use simple layouts that translate well to narrow screens
- Focus on one clear focal point per image
A mobile-first approach often leads to cleaner, more focused designs that perform better on desktops as well.
Content Calendar Design Strategy
Random posting doesn’t work. You need a content calendar with intentional graphic design variation:
- Monday: Educational graphics (infographics/data visualisation)
- Tuesday: Behind-the-scenes visuals
- Wednesday: Product/service highlights
- Thursday: User-generated content features
- Friday: Inspirational or entertaining content
This variety prevents visual fatigue while consistently delivering value to your audience.
Social Media Branding: Visual Consistency That Builds Trust

Your social media graphics should be instantly recognisable as yours, even without your logo. This requires:
- Consistent colour palette (3-5 core colours)
- Recognisable font pairings (1-2 fonts maximum)
- Signature visual elements or layouts
- Consistent photography style or illustration approach
When working with a fashion client, we created a distinctive border treatment that made their content instantly recognisable. Within 6 weeks, audience recognition increased by 64%.
Image Sizes for Social Media: The Complete 2026 Guide
Optimal image sizes remain stable in 2026, but mobile-first portrait formats (especially 4:5) now dominate feed performance across platforms. Here’s the updated cheat sheet with verified pixel-perfect specs.
Platform Specifications
Platform Specifications
Essential Aspect Ratios (2026)
- Feed priority: 4:5 portrait (1080×1350px) → 1:1 square (1080×1080px) → platform native landscape
- Link previews: 1.91:1 (1200×630px) Open Graph standard across Meta platforms
- Carousel rule: Match first slide ratio across all slides to prevent cropping chaos
- Stories/Reels: Universal 9:16 (1080×1920px) vertical
Common Mistakes Fixed
Pro Tips That Convert
- Instagram: Lead with 3:4 (1080×1440px) for maximum vertical real estate, fallback to 4:5
- Facebook: 4:5 outperforms landscape for feed posts despite algorithm support for 1.91:1
- LinkedIn: PDF carousels (1080×1350px pages) beat image carousels for document-style content
- X: 16:9 still rules timeline, but test 4:5 for scroll-stop power
- Accessibility: Always add alt text—drives SEO + screen reader engagement
Test every graphic live on the platform before publishing. Dimensions matter, but the feed crop and mobile preview determine conversion.
Engagement-Driven Graphics: What Works
After analysing thousands of high-performing posts, these design elements consistently drive engagement:
- Contrasting colours that create visual tension
- Directional cues (arrows, eye lines) that guide attention
- Negative space that lets the content breathe
- Text overlay that enhances rather than competes with imagery
- Visual metaphors that convey concepts quickly
The most engaging social media graphics combine these elements to deliver that instant value we’re after.
Carousel Post Design: The Secret Weapon
Carousel posts consistently outperform single images across platforms. The key to effective carousel design:
- The first slide must hook with a bold claim or question
- Each slide should deliver a complete thought
- Visual consistency between slides while maintaining interest
- Progressive narrative that builds toward a conclusion
- Final slide with clear call-to-action
The first slide sets the carousel aspect ratio.
Prepare all slides in 1:1 or 4:5 to avoid cropping.
One of my ecommerce clients switched to a carousel-first strategy and saw a 43% increase in website traffic from Instagram.
Motion Graphics for Social Media: The Attention Magnets
Even simple motion outperforms static images. You don’t need complex video skills:
- Subtle text animations
- Swiping transitions between concepts
- Basic element movements
- Pulsing or highlighting key information
- MP4 with H.264 is widely supported and efficient.
- Instagram feed does not accept animated GIF uploads.
- Convert animations to MP4 for the best playback quality.
- Keep text readable with sound off, autoplay is muted.
When we added subtle motion to a client’s previously static quote graphics, engagement increased by 32% overnight.
Social Media Image Optimisation Beyond Design
Great design isn’t just about aesthetics—it’s about performance:
- Load speed: Compress images appropriately
- Accessibility: Ensure text contrast meets WCAG standards
- Alt text: Add descriptive alt text for screen readers
- Hashtag research: Incorporate visual elements that align with trending hashtags
- Analytics tracking: Use UTM parameters on graphic links
Ship files that respect colour, contrast, and access needs.
- Export in sRGB IEC 61966-2.1 for colour accuracy.
- Meet WCAG 2.1 AA contrast, 4.5:1 for body text.
- Use 3:1 contrast for large text and UI elements.
- Avoid flashes above three times per second.
- Plan for dark mode with keylines or solid panels.
- Most platforms do not accept SVG post uploads.
- Use PNG for transparency and JPEG for photos.
- Add alt text on Instagram, Facebook, X, LinkedIn, and Pinterest.
- YouTube thumbnails have no alt text and use clear titles.
These technical optimisations can dramatically improve the performance of your graphics.
Post Design Inspiration: Where to Find Fresh Ideas
Even the best designers need inspiration. These are my go-to sources:
- Inkbot Design’s inspiration gallery for professional-grade examples
- Pinterest trend boards for emerging visual styles
- Award-winning advertising campaigns for breakthrough concepts
- Competitor analysis (what’s working in your niche)
- Cross-industry exploration (borrowing ideas from unrelated fields)
The key is not to copy but to understand why specific designs resonate and adapt those principles to your brand.
Social Media Aesthetic: Building a Cohesive Look
Your overall social media aesthetic matters more than individual posts. To develop yours:
- Define your brand personality in 3-5 adjectives
- Create a mood board that captures this feeling
- Select visual elements that reinforce these traits
- Develop templates that allow for variety while maintaining consistency
A strong aesthetic makes your content recognisable and builds brand equity with every impression.
Viral Image Post Formula
While virality can never be guaranteed, this formula consistently produces shareable graphics:
Emotional trigger + Unexpected twist + Clear takeaway = Viral potential
For example, one of my clients created a simple comparison graphic showing “What people think success looks like” versus “What success looks like” with a surprising contrast. It generated over 50,000 shares because it delivered an emotional truth in a visually striking way.
Meme Marketing: Relevance Without Trying Too Hard

Memes can be marketing gold or cringeworthy disasters. The difference:
- Deep understanding of the meme’s original context
- Authentic connection to your brand message
- Timeliness (memes have extremely short lifespans)
- Subtle branding that doesn’t kill the humour
When done right, meme-based graphics can generate massive organic reach at zero cost.
Social Media Visual Storytelling Framework
Every graphic should tell a micro-story. This framework makes it easy:
- Situation: Visual context setting
- Complication: Presenting a problem or question
- Resolution: Showing the answer or solution
- Action: Directing the viewer on what to do next
Even a single image can contain all these elements through thoughtful design.
Editable Post Templates: Creating Your Design System
Building a template system saves time and ensures consistency:
- Create master templates for each content type
- Develop a component library of graphic elements
- Establish clear rules for customisation
- Document your system for team use
When requesting custom templates from professional designers like Inkbot Design, providing these parameters ensures you get precisely what you need.
Story Highlights Covers: The Overlooked Brand Asset
Instagram Story Highlights sit in prime real estate on your profile. Their design deserves special attention:
- Use simple, iconic imagery that’s recognisable at small sizes
- Maintain a consistent style across all highlight covers
- Use colour coding to differentiate categories
- Balance distinctiveness with brand cohesion
Well-designed highlight covers increased profile navigation by 27% for one of my clients in the wellness space.
YouTube Thumbnail Design That Drives Clicks
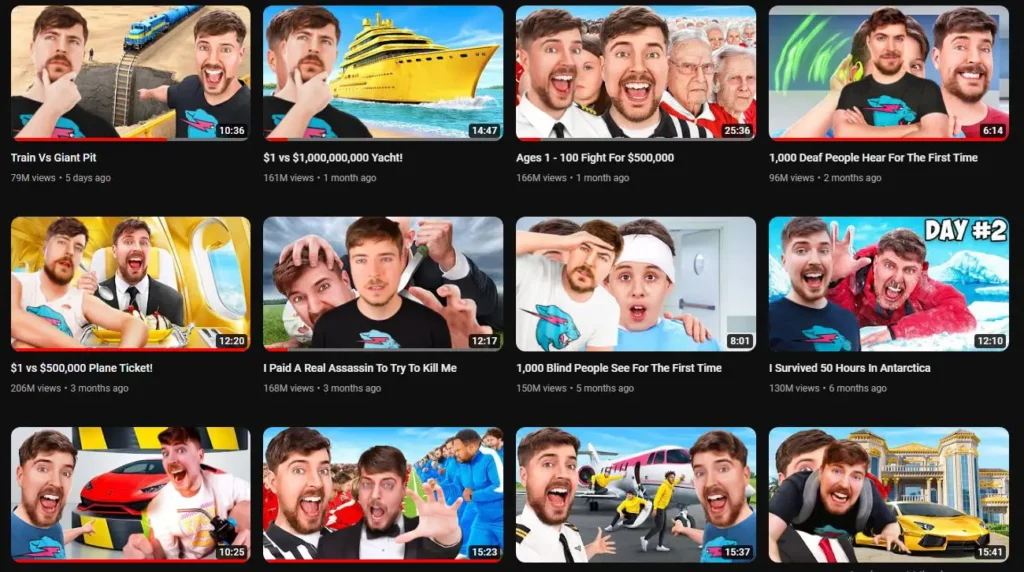
YouTube thumbnails are perhaps the most critical social graphics for video content:
- Use close-up faces showing emotion
- Include text (3-5 words maximum)
- Employ high colour contrast
- Create a consistent thumbnail style
- A/B test different approaches
- Use 1280×720, minimum width 640, at 16:9.
- Keep files under 2 MB and in JPG, PNG, or GIF format.
- YouTube Studio offers Test and Compare for thumbnails.
I have increased CTR by reducing the text to 4 words.
The difference between a good and great thumbnail can be a 40% increase in click-through rate.
Visual Identity on Social Platforms: Adaptation vs. Consistency
Your social media graphics should adapt to each platform while maintaining core brand identity:
- Identify which brand elements are flexible vs. fixed
- Create platform-specific templates that honour both requirements
- Develop a clear hierarchy of brand elements
- Document platform-specific guidelines
This balanced approach ensures your brand remains recognisable while optimising for each platform’s unique environment.
Social Post Mockups: Testing Before Publishing
Smart brands test graphics before publishing:
- View mockups on actual devices
- Test in different lighting conditions
- Get feedback from a sample audience member
- Compare against competitor content
This testing process has saved countless brands from publishing graphics that looked great in design software but failed in actual feeds.
Grid Layout Planning for Instagram

The Instagram grid is a canvas for your brand story:
- Plan content in groups of three or nine posts
- Consider how images will appear next to each other
- Create “breaker” posts to separate content themes
- Use consistent filters or editing styles
You can pin up to three posts on the grid.
Plan breaker tiles and campaigns with pinning in mind.
Planning your grid layout improves the profile visitors’ first impression and increases follow-through rates.
High-Performing Visuals: Data-Backed Design Decisions
Let data guide your design evolution:
- Track engagement metrics by design type
- Identify visual patterns in your top-performing content
- A/B test design variations
- Refine your approach based on results
One finance client discovered their audience responded best to dark backgrounds with bright accent colours—the opposite of their initial design approach. Data revealed this preference.
Branded Quote Graphics That Get Shared
Quote graphics remain highly shareable when done right:
- Select quotes that align with your audience’s aspirations
- Use typography as the hero element
- Add subtle branded elements
- Leave space for the platforms’ sharing interfaces
The most shared quote graphics help people express something they already believe but couldn’t articulate as well themselves.
Trending Template Styles in 2026
Stay current with these emerging design trends:
- Brutalism 2.0: Raw, unfiltered aesthetics with modern refinement
- Eco-minimalism: Sustainable-inspired visuals with natural textures
- Data-tainment: Making statistics visually engaging and playful
- Nostalgic futurism: Retro elements reimagined with cutting-edge techniques
Incorporating trend elements keeps your brand relevant without chasing every design fad.
Colour Palette for Social Media: Psychology-Based Selections
Colour choices dramatically impact performance:
- Red/Orange: Creates urgency and excitement
- Blue: Builds trust and reliability
- Green: Conveys growth and wellness
- Purple: Suggests creativity and luxury
- Neutral with pop colour: Provides sophistication with emphasis
The most effective approach combines your brand colours with psychological colour theory for specific content goals.
Call-to-Action Overlays That Convert
Effective CTAS in graphics follow these principles:
- Clear, action-oriented language
- Visual distinction from other elements
- Positioning at a natural eye-flow endpoint
- Benefit-focused rather than instruction-focused
Subtle changes to CTA design can yield dramatic improvements in conversion. One client saw a 24% increase in swipe-ups by changing their CTA from “Learn More” to “See How,” with a more visually compelling treatment.
User-Generated Content Visuals: Authenticity at Scale

UGC is powerful but needs thoughtful design treatment:
- Develop templates that elevate amateur content
- Create consistent branded frames or overlays
- Establish content submission guidelines for users
- Balance an authentic feel with a professional presentation
Brands that effectively design around UGC see 29% higher engagement rates than those using only professional photography.
Engagement Metrics for Graphics: What to Track
Track these metrics to evaluate graphic performance:
- Engagement rate: Total engagements divided by reach
- Save rate: Significant on Instagram
- Share-to-like ratio: Indicates true resonance
- Comment sentiment: Quality of conversation generated
- Click-through performance: Ultimate action metric
- Engagement rate by reach equals engagements divided by reach.
- Save rate equals saves divided by reach on Instagram.
- The share-to-like ratio equals shares divided by likes.
- Click-through rate equals the number of link clicks divided by the number of impressions.
- Include formulas in reports for clarity across teams.
Focus on metrics that align with your business goals rather than vanity metrics.
Audience-First Visuals: Designing for Psychographics
The most effective social media graphics are designed for a specific audience’s psychographics:
- Identify your audience’s core values and aspirations
- Determine their aesthetic preferences (e.g., minimalist vs detailed).
- Understand their platform-specific behaviours
- Create visual systems that connect with these characteristics
When we redesigned a fitness brand’s social graphics to align with their audience’s aspirational self-image rather than current reality, engagement increased by 78%.
Storytelling Through Graphics: The Visual Narrative Arc
Even standalone graphics should tell a complete story:
- Context: Where/when is this happening?
- Character: Who is this relevant to?
- Conflict: What problem exists?
- Resolution: How is it solved?
This narrative structure can be achieved through thoughtful visual hierarchy and design elements.
