Annual Report Brand Guidelines Must Govern More Than Design
Annual reports expose whether a company's brand guidelines work under pressure. Reporting rules must govern typography, colour, financial charts, sustainability disclosures, accessibility and approval responsibilities. The strongest system protects consistency without disguising poor performance. This guide explains what to include and how to test those rules before publication.



On this page8 min left
- What Should Annual Report Brand Guidelines Govern?
- Which Visual Identity Rules Belong in a Corporate Report?
- How Should Financial and Sustainability Information Be Presented?
- How Should Accessibility and Digital Reporting Shape the Guidelines?
- How Do You Govern Reporting Exceptions During a Difficult Year?
- Test Your Reporting Rules Against an Unfavourable Year
- Questions people ask
Annual report brand guidelines should control how a company presents its performance, not simply how it displays its logo.
For a professional services business preparing for growth, an acquisition, or a repositioning, that distinction matters. A report needs to remain recognisable when revenue falls, targets are missed, or an uncomfortable disclosure takes up half a page.
PwC's 2024 Global Investor Survey reportedly found that two-thirds of investors base their trust in sustainability disclosures on the consistency and comparability of data year on year.
Consistency is a reporting responsibility, not merely a design preference.
What Should Annual Report Brand Guidelines Govern?
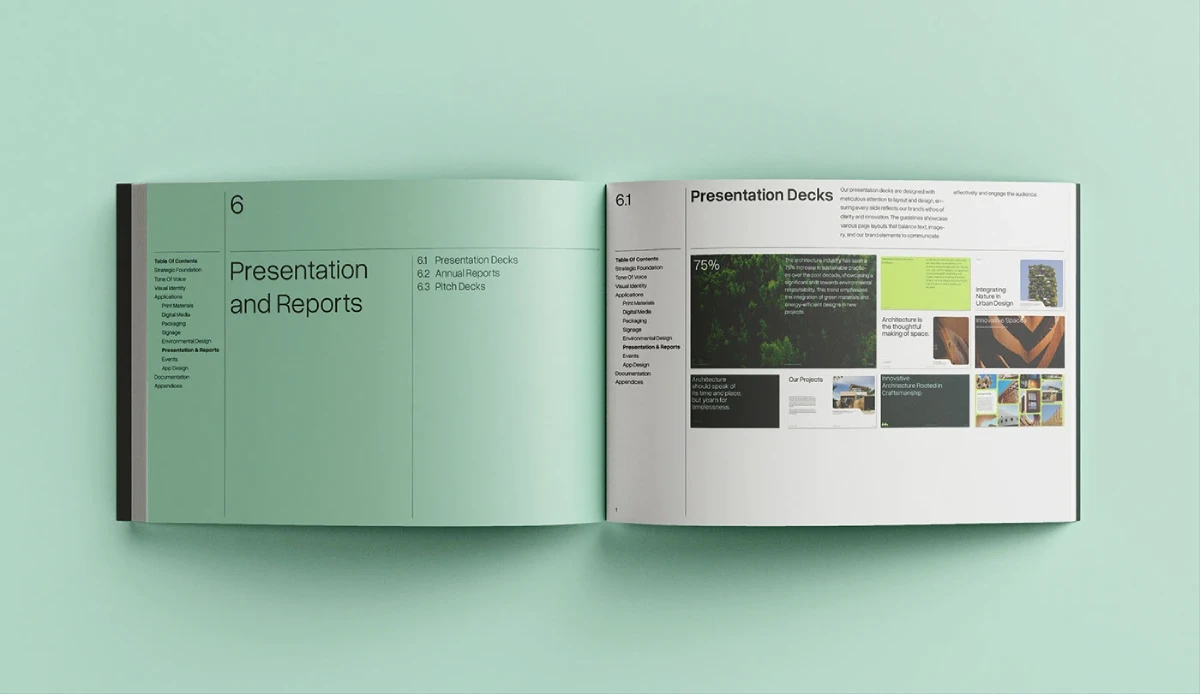
Annual report brand guidelines define how corporate identity, financial information, sustainability disclosures and supporting communications should appear across an organisation's annual reporting materials.
A reporting-specific guide should establish:
- Which brand identity elements must remain consistent.
- How financial and non-financial information is presented.
- Which accessibility requirements take precedence over visual preferences.
- How disclosures, exceptions and approval decisions are controlled.
A conventional corporate identity manual provides the starting point. The reporting extension explains how those rules operate in a document containing financial results, operational commentary and information intended for investors and other stakeholders.
Consider a 75-person accountancy practice preparing its first consolidated annual report following an acquisition. The original identity manual might specify a logo, colour palette and typography. It may say nothing about combining two sets of performance charts, presenting historical comparisons or distinguishing acquired operations from established business units.
That is a governance gap.
The wider brand operating system framework provides the strategic context for managing identity consistently across different business functions.
The reporting guide should sit within that wider system rather than become an isolated collection of design instructions.
Which Visual Identity Rules Belong in a Corporate Report?
A report can follow the corporate identity manual perfectly and still be difficult to read. The problem usually appears in the details: a footnote reduced to fit a page, an accent colour used for small financial labels or a chart whose typography changes halfway through the document.
The reporting guide needs to specify which identity rules are fixed and which must adapt to the demands of the information.

Logo placement and corporate identity
Specify approved logo versions, minimum sizes, clear space, background treatments and placement rules.
A report cover may use a more expressive composition than an individual financial statement. That flexibility is acceptable provided the identity remains recognisable, and the logo is not altered to accommodate a particular layout.
Define the rules for subsidiaries, acquired businesses and co-branded reporting where applicable.
Typography and document hierarchy
Specify typefaces, weights, sizes and hierarchy for:
- Main section headings.
- Financial table headings.
- Body copy.
- Footnotes and explanatory notes.
- Chart labels.
- Captions and disclosures.
Footnotes deserve particular attention. Reducing their size to make a page look cleaner can make the underlying information difficult to read.
Set minimum readable sizes through actual document testing, including print and digital versions. Avoid assuming that a typeface which works on a large presentation slide will remain legible in a dense financial statement.
Colour and visual hierarchy
Define primary, secondary and neutral colours, together with their approved uses.
A brand palette may contain a bright accent colour intended for marketing communications. That does not automatically make the colour suitable for small chart labels, dense financial tables or text on a coloured background.
Document approved combinations and contrast requirements.
Where a brand colour cannot deliver sufficient contrast, the accessibility requirement takes precedence. The visual identity must accommodate that decision.
Imagery, illustrations and graphic elements
Set rules for photography, icons, illustrations and decorative devices.
A professional services report should not use unrelated stock photography simply to fill white space. Images should have a clear editorial purpose.
Specify whether photography is permitted in financial sections, whether illustrations can communicate operational processes and how decorative graphics must remain separate from financial data.
How Should Financial and Sustainability Information Be Presented?
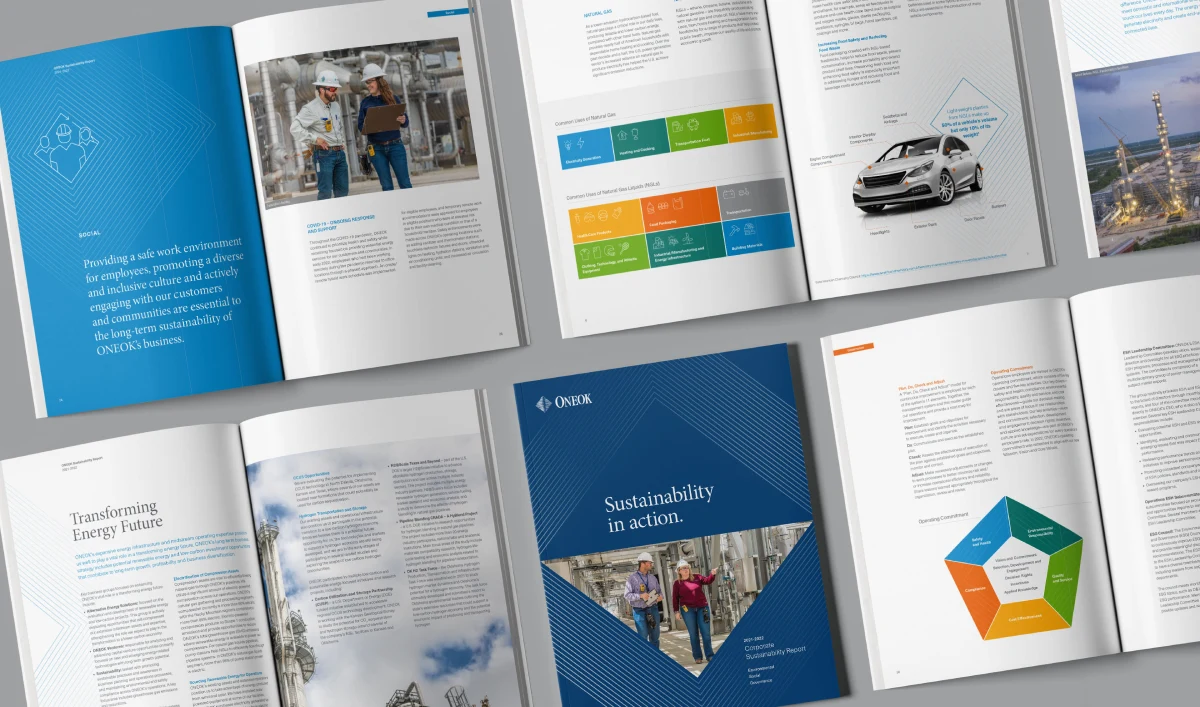
Financial and sustainability information needs its own visual governance rules because readers must be able to interpret results, compare periods and distinguish reported figures from commentary.
This is where a conventional brand manual usually needs to be extended.
Financial charts need consistent conventions
Define a reporting chart system covering:
Element | Guideline requirement |
|---|---|
Revenue charts | Consistent currency, units and reporting periods |
Profitability charts | Clearly identified measures and comparison periods |
Bar charts | Consistent axis treatment and labelling |
Line charts | Clearly defined time intervals and series |
Tables | Consistent number formats, headings and footnotes |
Forecasts | Visually distinguishable from actual results |
A professional services group reporting revenue across three divisions, for example, should not use different units or inconsistent periods in each division's charts.
If one division reports figures in thousands of pounds and another reports millions, the presentation must make that distinction unmistakable.
The same principle applies to percentage changes, financial years and comparative figures.
A chart should clarify the underlying data. It should never make a weak result appear better through a truncated axis, selective comparison period or misleading visual emphasis.
Sustainability disclosures need repeatable presentation rules.
Sustainability reporting introduces additional challenges because organisations may report different environmental and social indicators across reporting periods.
Define how the report presents:
- Environmental performance indicators.
- Social impact measures.
- Governance information.
- Targets and progress against targets.
- Methodology notes and reporting boundaries.
- Changes to measurement methods.
Consistency matters when stakeholders compare information across years.
PwC's Survey reportedly found that 44% of respondents believed corporate sustainability reporting contained unsupported claims to a large or very large extent.
The finding, if confirmed, reinforces the need for a clear distinction between measured outcomes, stated ambitions and explanatory commentary.
A company reporting a reduction in emissions should make the reporting period, measurement boundary and basis of comparison clear. A headline figure without that context can leave readers with an incomplete impression.
Inkbot Design's guide to ESG report design addresses the wider visual presentation of environmental, social and governance reporting.
Protect comparability when the reporting method changes
A change in measurement methodology can make year-on-year comparisons difficult.
The reporting guide should specify how changes to methodology are disclosed, how historical figures are treated where appropriate, and who approves explanatory notes.
Do not quietly redesign a chart to conceal a break in comparability.
The presentation must make the change understandable.
How Should Accessibility and Digital Reporting Shape the Guidelines?
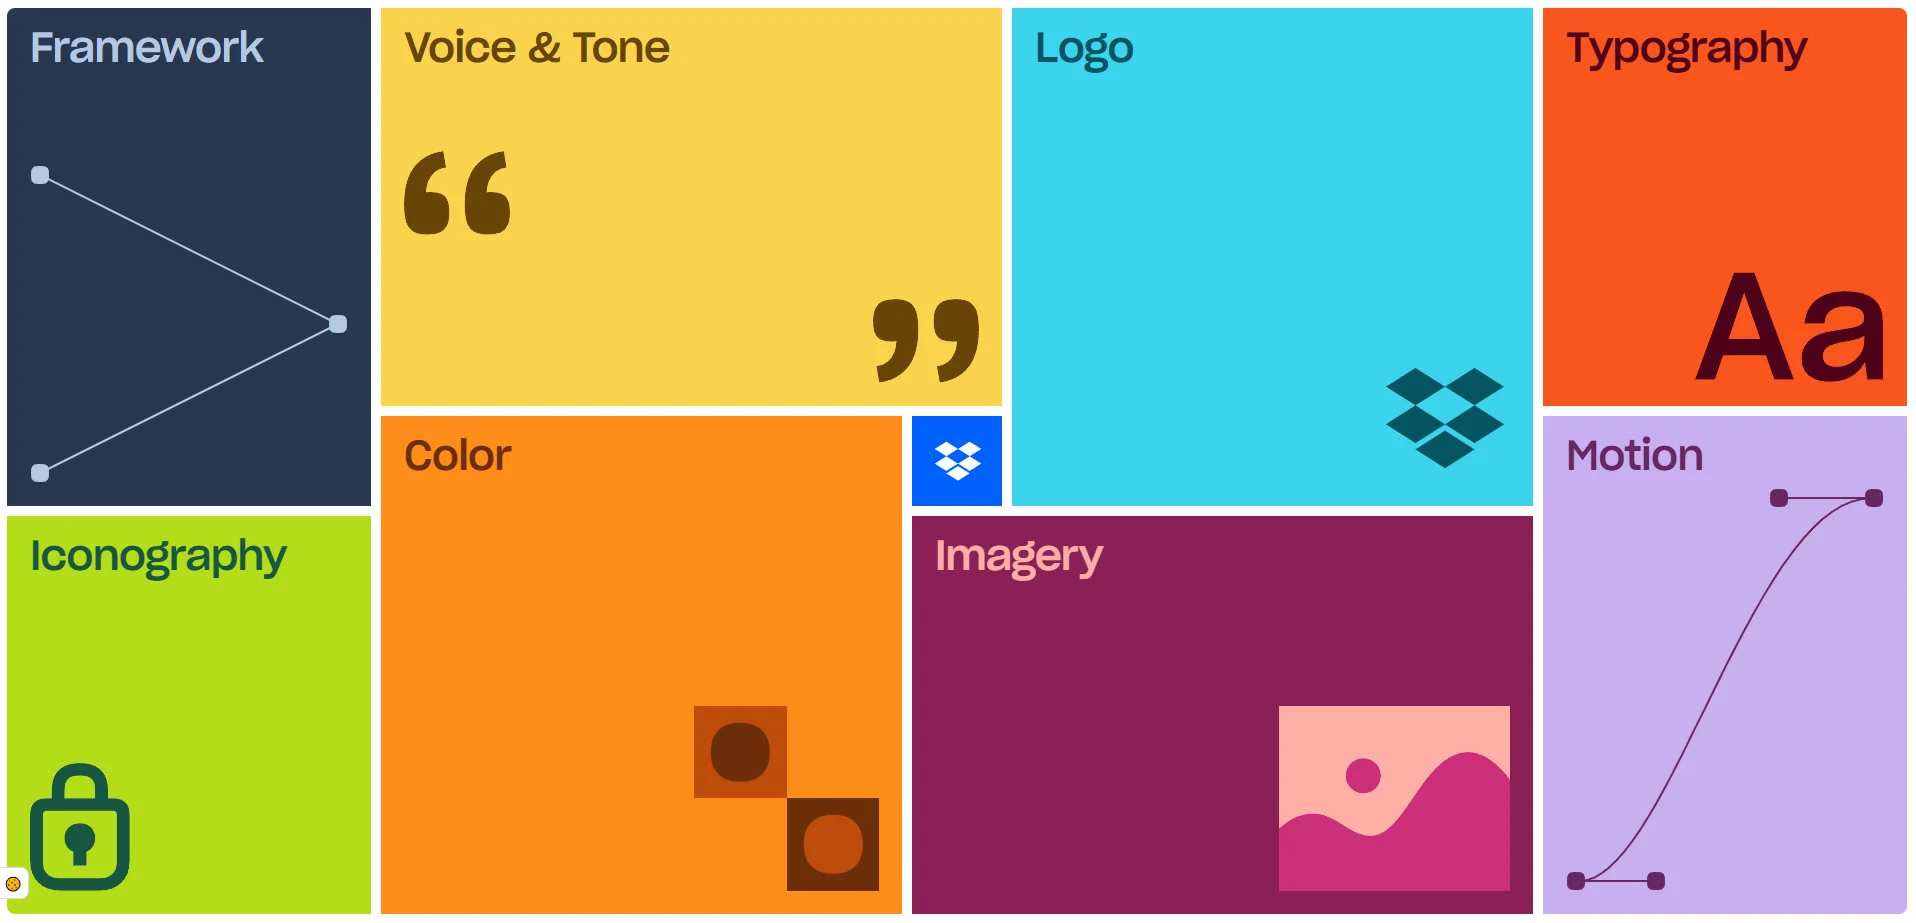
A corporate report should remain readable when viewed on a laptop, printed in black and white or enlarged by a reader using assistive technology. A pale brand colour that works in a large decorative heading may fail when used for small text over a white background.
The guidelines should specify approved contrast combinations and require testing of the final document, not simply approval of the original design mock-up.
The reporting document should address:
- Colour contrast for text and graphical information.
- Readable type sizes.
- Logical heading structures.
- Descriptive links.
- Alternative text for meaningful images and charts.
- Reading order in digital documents.
- Tagged PDF structure where applicable.
- Accessible tables and document navigation.
Colour must never be the only way to communicate meaning.
For example, a financial chart that uses green for positive performance and red for negative performance should also include labels, symbols, or another distinguishing feature. A reader should not have to rely on colour perception to interpret the result.
The digital accessibility principles should inform the wider reporting system, particularly where reports are distributed as downloadable documents.
Print and digital versions need separate checks.
A document designed for a printed A4 page may be difficult to use on a mobile screen.
The guidelines should establish separate quality checks for:
- Printed reports.
- Desktop PDF documents.
- Mobile PDF documents.
- HTML or interactive reports, where used.
An interactive report also needs controls that work with keyboard navigation and assistive technology.
Accessibility standards and legal obligations must be checked against the specific format, audience and jurisdiction. A design guide alone does not establish regulatory compliance.
How Do You Govern Reporting Exceptions During a Difficult Year?
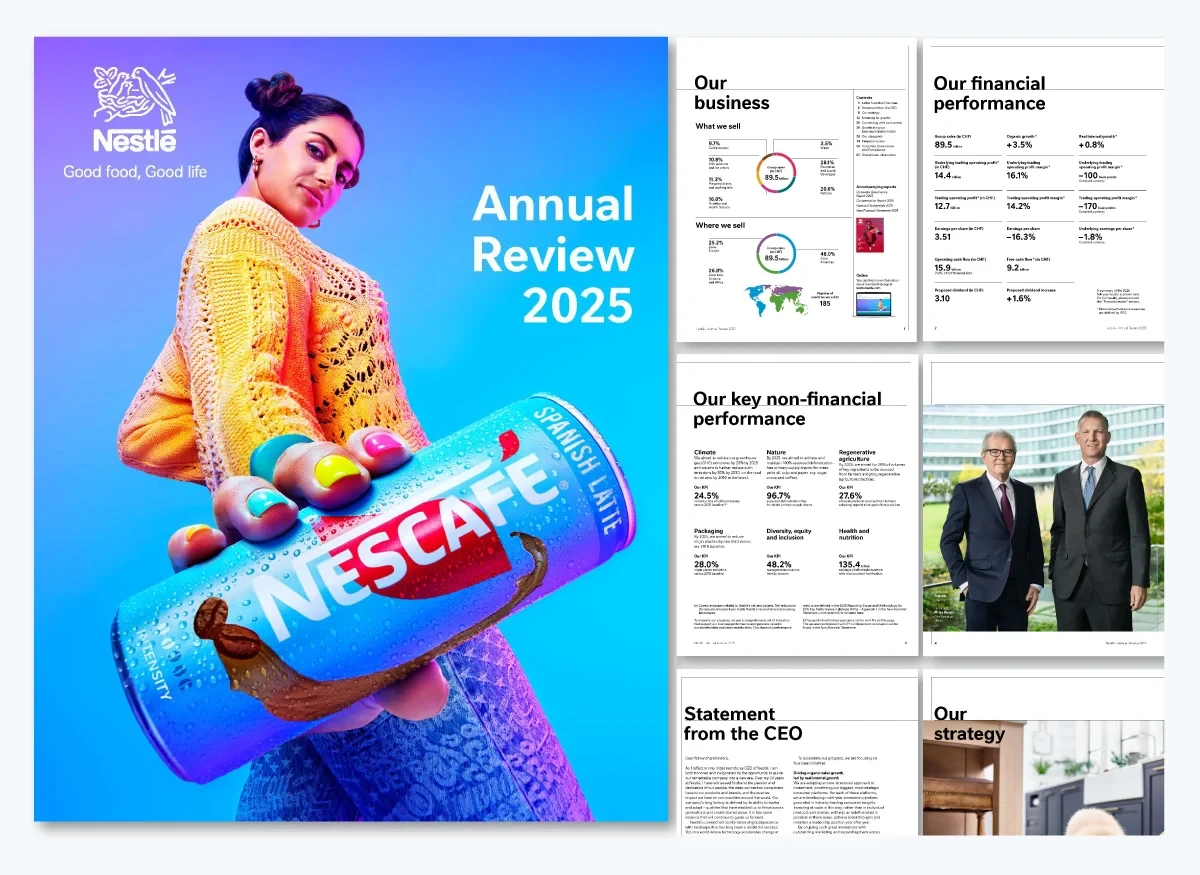
Reporting governance should define who can approve changes to established design rules, when exceptions are permitted and how the reason for each exception is documented.
This is the most important extension to a conventional brand manual.
A successful reporting year rarely tests the limits of a visual identity. A difficult year does.
Consider three situations:
- Revenue declines and the financial results require more explanatory commentary.
- An acquisition changes the reporting structure and historical comparisons.
- A missed sustainability target requires a more prominent explanation.
The guidelines must accommodate these situations without allowing individual contributors to manipulate the presentation.
Establish approval responsibilities
A reporting governance document should identify the following responsibilities:
Responsibility | Accountable function |
|---|---|
Financial figures and reconciliation | Finance |
Financial explanations and disclosures | Finance and relevant reviewers |
Brand identity and visual consistency | Brand or marketing leadership |
Accessibility and document quality | Design and accessibility reviewers |
Regulatory and legal sign-off | Relevant qualified advisers |
Final publication approval | Designated executive authority |
The exact allocation depends on the organisation's structure and reporting obligations.
A 50-person consultancy may have one finance director, a marketing lead and an external design agency. A 200-person professional services group may require additional business-unit and compliance approvals.
The principle remains the same: no critical reporting decision should be left to an informal email exchange between a designer and whoever happens to be available.
The table only works if decision rights are explicit. Finance should not change the underlying figures because a chart looks awkward. Marketing should not remove an explanatory note because it disrupts the layout. An external designer should not decide whether a disclosure can be shortened.
When those responsibilities conflict, the designated executive approval route must resolve the issue. Accuracy and required disclosure take priority over visual preference.
Create an exception register.
The guidelines should include a simple record of approved departures from the standard system.
Each entry should capture:
- The affected page or reporting component.
- The original design rule.
- The reason for the exception.
- The person authorising it.
- The date and reporting period.
- Whether the exception becomes a permanent rule.
For example, a report may require a longer disclosure than the standard page template accommodates. The designer may need to change the layout, increase the page count or introduce an additional explanatory section.
The decision should preserve readability and the prominence of disclosure.
It should not result in smaller text simply because the original template has run out of space.
Apply the difficult-year test before approving the guidelines
Use these five scenarios as a practical commissioning checklist:
- Revenue falls: Can the reporting system present negative performance clearly without changing chart conventions?
- Targets are missed: Can the report explain the difference between target and actual performance without burying the shortfall?
- An acquisition occurs: Can the identity system accommodate additional reporting entities and comparative information?
- A disclosure expands: Can the layout accommodate additional text without compromising legibility?
- A sustainability claim changes: Can the reporting system explain revised measurements, boundaries or methodology?
The difficult-year test exposes weaknesses that a polished brand presentation will not.
“A reporting identity earns its credibility when the figures become uncomfortable. A brand guide that only works for favourable results is incomplete. The logo can remain in the same position while revenue declines, a target is missed, or a disclosure becomes longer. The rules governing the information must remain equally dependable.”
Test Your Reporting Rules Against an Unfavourable Year
Annual report brand guidelines should control the presentation of performance as carefully as the presentation of corporate identity.
A logo specification and colour palette are a starting point. Finance teams need consistent chart conventions. Sustainability reporting needs clear methodology and comparison rules. Digital documents need accessibility checks. Executives need defined approval responsibilities.
The difficult-year test brings these requirements together.
If your organisation is preparing for a rebrand, acquisition or reporting overhaul, review the existing identity manual before commissioning another document. Identify where the rules break down when the information becomes complicated or commercially sensitive.
Inkbot Design offers a free Brand Equity Audit™ to identify where your brand is losing commercial ground and what needs attention. It is a useful starting point if your corporate identity no longer reflects the business you are building.
Start with the reporting rules. Test them against your least favourable reporting scenario.
Questions people ask
What is the difference between brand guidelines and annual report brand guidelines?
Corporate brand guidelines govern the organisation's overall identity, including its logo, typography, colours and visual language. Annual report guidelines extend those rules to financial tables, performance charts, sustainability disclosures, document accessibility and approval responsibilities. The reporting extension addresses requirements that a general identity manual may not cover.
Should annual report brand guidelines include financial chart templates?
Yes. Financial chart templates should specify units, currency, reporting periods, axis conventions, labels and comparative data presentation. Consistent templates help readers compare performance across divisions and reporting years. Finance should approve the underlying figures, while brand and design teams control the visual presentation.
Who should be responsible for annual report brand guidelines?
The organisation should assign joint responsibility to finance and brand leadership. Finance controls the accuracy and interpretation of financial information, while brand leadership maintains visual consistency. Legal, compliance and accessibility specialists should review relevant requirements. A designated executive should approve the final reporting document.
Should annual report brand guidelines cover ESG disclosures?
Yes. Sustainability and environmental, social and governance disclosures should follow documented rules for presenting measurements, targets, reporting boundaries, methodology and year-on-year comparisons. The design system should distinguish measured performance from commitments and commentary. Sustainability reporting should never rely on visual treatment to imply progress unsupported by the underlying data.
How often should annual report brand guidelines be updated?
Review the guidelines before each reporting cycle and whenever a material change affects the reporting structure, identity, disclosure requirements or document format. An acquisition, a new reporting methodology, or a change to accessibility requirements may justify an immediate review. Record approved changes so subsequent reports remain comparable.