
How to Build an In-House Brand Health Dashboard That Drives Commercial Decisions
According to research from Gartner’s 2025 Brand Health Framework, 57% of brand leaders regularly assess brand health, yet only 21% report that these insights lead to actionable organisational decisions.
Most tracking systems collect data for the sake of reporting. They present colourful charts of social mentions, generic sentiment, and unweighted awareness scores that tell a Managing Partner nothing about why the firm lost a £200,000 pitch to a boutique rival.
For professional services firms preparing for a growth push or market repositioning, an ineffective dashboard is an expensive distraction. Unactionable tracking creates a false sense of security, while positioning drift quietly erodes fee elasticity.
Before committing capital to a rebrand, leadership requires an objective baseline via structured brand audits to identify where commercial ground is being lost.
Building an in-house brand health dashboard is not an exercise in data gathering—it is the construction of a decision framework.
- Establish pre-agreed decision triggers tied to specific operational actions, with a single executive owner responsible for escalation.
- Focus on high-signal metrics: brand trust, share of search, and creative consistency rather than vanity metrics.
- Measure creative consistency quarterly; audit pitches and proposals, and monitor AI visibility across ChatGPT, Claude, and Perplexity.
- Map perception metrics directly to commercial KPIs: pitch win-rate, average fee realisation, and recruitment cost.
- Avoid composite single-scores; isolate metrics and set independent red lines to protect fee elasticity and actionability.
How to Build an In-House Brand Health Dashboard
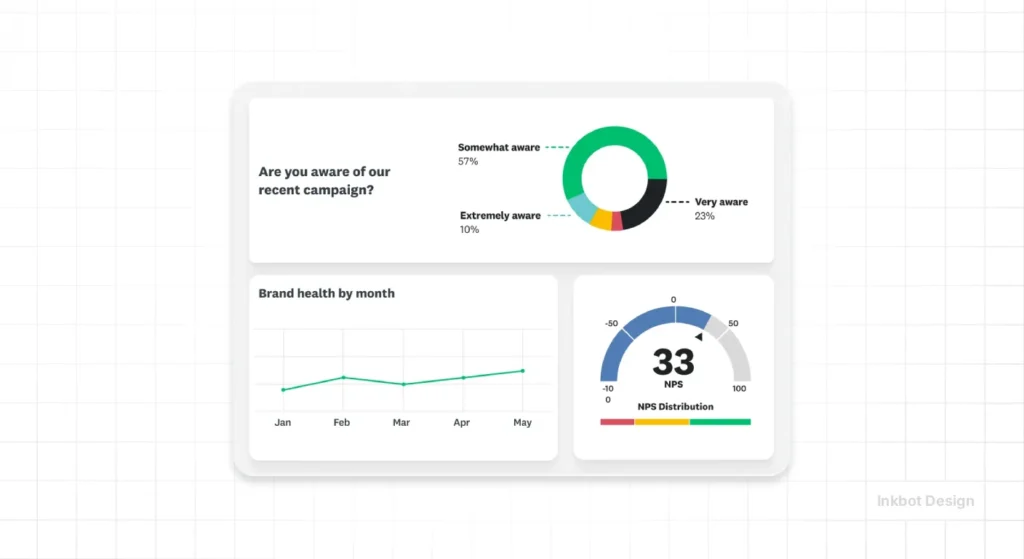
An in-house brand health dashboard is built in four operational stages: defining decision triggers, selecting high-signal metrics, establishing measurement cadences, and mapping perception to commercial outcomes.
- Stage 1: Define Decision Triggers: Establish explicit threshold rules for board action before selecting data feeds.
- Stage 2: Select High-Signal Metrics: Isolate measures for trust, share of search, and positioning differentiation over generic awareness.
- Stage 3: Establish Measurement Cadence & AI Visibility: Balance quarterly survey inputs with real-time digital and AI discovery signals.
- Stage 4: Map Perception to Commercial Operations: Link perception shifts directly to fee elasticity, pitch win-rates, and recruitment costs.
An in-house brand health dashboard is a decision framework that measures market perception, brand consistency, and search demand to guide strategic commercial choices.
Prerequisites for Building an In-House Tracking System
Attempting to build a tracking system without clear operational foundations produces metric overload. Professional services firms employing 50 to 200 people must establish three entry conditions before selecting software or designing spreadsheets.
- A Clearly Defined Target Audience: You cannot measure perception across “the market”. Define the exact buyer profile—such as Finance Directors of mid-market UK logistics businesses—to focus data capture.
- Documented Brand Positioning Assets: High-signal tracking compares market reality against an intended standard. You must have documented positioning codes, core propositions, and value drivers.
- Executive Ownership: Assign a single owner—typically the Marketing Director or Commercial Director—with authority to act when metrics breach predefined thresholds.
Stage 1: Define Decision Triggers Over Data Collection
The single largest failure mode in brand measurement is collecting metrics without deciding what happens when they change. A useful dashboard establishes specific decision rules before any data is ingested.
If brand trust drops by 4 points among mid-market buyers, which operational lever moves? If the share of search increases by 15% while pitch conversion stays flat, who investigates the sales enablement pipeline? Without pre-agreed triggers, data becomes background noise.
“A brand health dashboard that merely reports numbers is a cost centre. A dashboard that dictates pre-agreed operational decisions when metrics breach defined boundaries is a commercial asset.”
Stage 2: Select High-Signal Operational Metrics
Avoid populating your system with soft consumer metrics. Professional services purchases are high-consideration, risk-averse, and long-cycle. Focus on three high-signal categories.
1. Brand Trust and Category Reputation
Trust is not a soft reputational luxury; it is a direct multiplier of commercial effectiveness. The Institute of Practitioners in Advertising (IPA) analysed 812 effectiveness case studies between 1998 and 2024.
Their data revealed that 93% of for-profit campaigns reporting very large increases in brand trust also recorded at least one very large commercial business effect, compared to 66% across the broader database.
Furthermore, the IPA noted that while fewer than 40% of campaigns cited trust as an explicit objective between 1998 and 2009, over two-thirds did so between 2020 and 2024.
Measure trust through targeted biannual buyer panels, asking prospects to rate your firm’s reliability, category expertise, and risk profile against three primary competitors.

2. Share of Search (Active Market Interest)
Share of search represents your firm’s proportion of organic search queries within a defined category compared to key competitors.
Google’s 2024 Modern Brand Measurement playbook highlights a 0.83 correlation between share of search and market share, citing research by Les Binet.
Track search volume for your firm’s brand name alongside direct competitors using Google Keyword Planner or search intelligence tools.
While search behaviour is influenced by factors beyond media spend, sustained drops in search share reliably predict a decline in pipeline volume 6 to 12 months before they impact revenue.
3. Metric Correlations with Sales Outcomes
Brand metrics are not vanity numbers when properly contextualised.
Nielsen’s analysis across thousands of commercial campaigns demonstrates that a one-point gain in brand metrics such as awareness and consideration typically correlates with a 1% increase in sales.
Use consideration scores to monitor top-of-funnel health, ensuring you measure qualified prospect consideration rather than general public awareness.
Stage 3: Measure Creative Consistency and AI Discovery
A modern brand dashboard must account for how consistency builds equity and how new digital platforms synthesise your reputation.
Measuring Creative and Proposition Consistency
Brand consistency directly impacts commercial growth.
A 2025 study by System1, evaluating over 4,000 advertisements from the IPA Effectiveness Databank across five years, discovered that brands in the top 20% for creative consistency achieved 28% more “Very Large Business Effects” than inconsistent competitors.
Given equivalent media investment, highly consistent brands grew market share twice as effectively over a five-year period.
Audit your firm’s output quarterly. Assign a consistency score based on whether pitch proposals, sector reports, and digital touchpoints correctly apply your core visual codes and messaging frameworks.
The Emerging AI Discovery Layer
Prospects increasingly use AI-powered search environments to research professional partners. Research by Kantar in 2025 highlights that AI recommendation engines heavily shape how corporate buyers discover and evaluate service providers.
Traditional tracking monitors Google rankings, web traffic, and social mentions.
Modern dashboards must add an AI visibility check: monitor how platforms like ChatGPT, Claude, and Perplexity describe your firm when prompted with category searches (e.g., “Who are the leading corporate restructuring specialists in the UK?”).
Track whether AI models correctly identify your core capabilities or mix your firm up with lower-tier competitors.
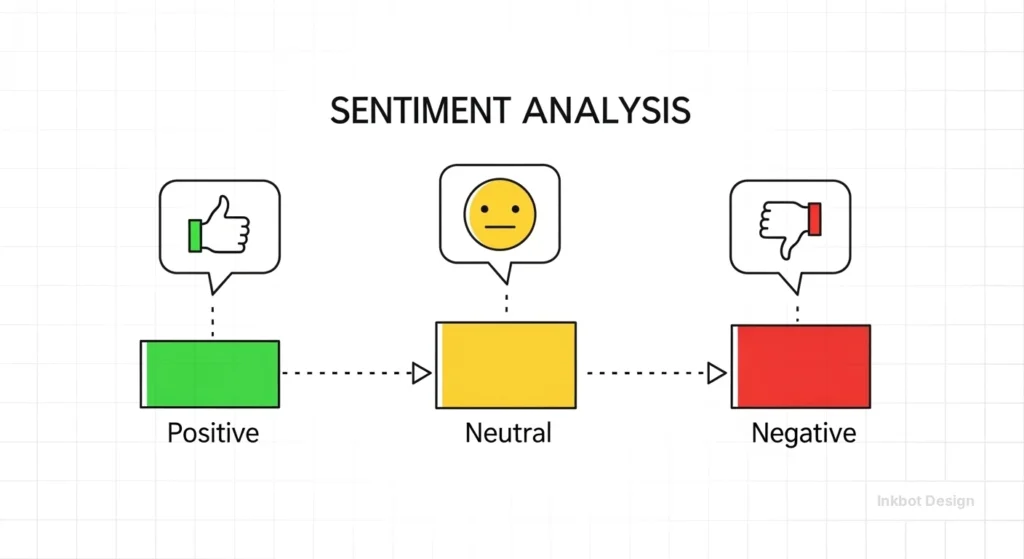
Where sentiment or contextual perception shifts online, combining tracking with qualitative sentiment analysis helps identify the underlying narrative drivers.
Stage 4: Map Perception to Commercial Operations
A brand health dashboard reaches its full utility when directly connected to commercial delivery metrics.
1. Perception Layer
- Prompted Brand Trust
- Category Consideration
- AI Discovery Visibility
2. Behavioural Layer
- Share of Search (Binet)
- Creative Consistency Score
- Sentiment & Narrative Drift
3. Commercial Layer
- Pitch Win-Rate (%)
- Average Fee Realisation
- Recruitment Cost / Time
- Fee Elasticity and Rate Card Acceptance: When brand trust and differentiation scores rise, fee resistance decreases. Track average hourly billing rates or fixed project fees against your brand differentiation index.
- Pitch Win-Rate and Sales Cycle Velocity: Track the conversion rate of formal proposals. If brand consideration is high but pitch win rates fall, the brand promise is creating expectations that sales enablement collateral fails to meet.
- Recruitment and Talent Acquisition Cost: A strong brand lowers recruitment fees and time-to-hire. Track cost-per-hire alongside your employer brand perception metrics.
The Human Layer in Brand Measurement
Software can aggregate data, but it cannot interpret nuance.
An automated dashboard might flag a 10% drop in social media engagement as an emergency.
An experienced brand strategist recognises that for a £15m commercial law practice, social engagement is a secondary signal.
Conversely, a subtle two-point drop in buyer trust among corporate finance directors—often masked within a composite score—can signal impending pitch losses worth millions.
A 120-Person UK Accounting Practice
Consider a 120-person UK accounting firm preparing to launch a corporate finance advisory practice. The firm built a streamlined, four-metric in-house dashboard:
- Metric 1: Share of Search (UK Corporate Finance regional queries).
- Metric 2: Prompted Trust Score (survey of 100 regional CFOs).
- Metric 3: Creative Consistency Score (audit of proposal documents).
- Metric 4: Pitch Win-Rate (internal CRM data).
The Findings and Operational Action
After two quarters, the dashboard revealed a clear pattern:
The data showed that top-of-funnel demand was expanding (Share of Search up 6%), but pitch conversion was collapsing (Win-Rate down 12%).
Because the dashboard tracked Creative Consistency, leadership quickly identified the cause: individual partners were creating bespoke, unbranded proposal slide decks that presented conflicting positioning claims.
Instead of wasting £50,000 on additional top-of-funnel advertising, the firm enforced strict visual guidelines and unified its pitch deck. Within two quarters, the win-rate recovered to 38%.
Why Composite “Brand Scores” Fail Professional Services Boardrooms
Many brand consultancies sell proprietary composite scores—a single number from 1 to 100 representing “Overall Brand Health.
These single-score models are flawed for professional services leadership.
A composite score of 72/100 can remain completely flat while brand trust collapses by 15% and vanity social traffic rises by 20%. The composite number gives the board a false sense of stability while the firm loses fee elasticity.
“A single composite brand score offers comfortable simplicity at the expense of actionable truth. Isolate your metrics, preserve their context, and tie each directly to an operational owner.”
The Verdict
An in-house brand health dashboard should never be built as a passive scorecard. Its sole purpose is to convert market perception into clear, pre-agreed executive decisions.
By focusing on high-signal metrics—brand trust, share of search, creative consistency, and AI discovery—and mapping them directly to pitch win rates and fee elasticity, professional services leaders protect their firms against positioning drift.
If you are planning a strategic rebrand or repositioning exercise, start by establishing your baseline.
Request a free Brand Equity Audit™ from Inkbot Design to identify exactly where your brand is losing commercial ground and construct a measurement framework tailored to your growth goals.
FAQs
What is an in-house brand health dashboard?
An in-house brand health dashboard is an internal measurement system that tracks key brand metrics—such as trust, share of search, and creative consistency—and connects them directly to operational decisions and commercial outcomes.
How often should a professional services firm update its brand dashboard?
Professional services firms should update digital metrics such as monthly share of search, audit creative consistency and AI discovery quarterly, and review buyer trust and commercial win rates biannually.
What is the most important metric on a brand health dashboard?
No single metric suffices, but brand trust is the strongest indicator of commercial performance. IPA research shows that 93% of campaigns that achieve large gains in trust also achieve large business effects.
How does Share of Search correlate with market share?
According to Google’s 2024 Modern Brand Measurement playbook, share of search has an estimated correlation of 0.83 with market share, making it a reliable proxy for active market demand.
Why do composite brand scores fail in B2B tracking?
Composite brand scores fail because averaging multiple metrics masks severe drops in critical areas, such as trust or pitch conversion, behind increases in less important vanity metrics like social traffic.
How does creative consistency impact business growth?
A 2025 System1 study found that brands in the top 20% for creative consistency achieved 28% more Very Large Business Effects and grew market share twice as efficiently as inconsistent competitors.
Can small or mid-sized firms build an in-house dashboard without expensive software?
Yes — mid-sized firms can construct an effective dashboard using accessible tools like Google Keyword Planner, internal CRM data, quarterly pitch audits, and simple biannual buyer perception surveys.
What is the actionability gap in brand health tracking?
The actionability gap refers to Gartner’s finding that while 57% of brand leaders track brand health, only 21% report that the resulting insights lead to actionable business decisions.
How do AI search engines affect brand health tracking?
AI search engines summarise brand reputation directly for buyers, making it essential to monitor how tools like ChatGPT and Perplexity describe your firm’s category positioning and core capabilities.
How do you link brand health metrics to fee elasticity?
Link brand health to fee elasticity by tracking average billing rates and proposal acceptance alongside buyer trust scores; higher trust directly reduces client fee resistance during pitches.
