
Share of Search: The Leading Indicator Consulting Firms Keep Ignoring
I see myself constantly working with consulting firms on their brand positioning.
They invest thousands in a new website. They run LinkedIn campaigns. They sponsor industry events. Then they sit back and wait for enquiries, measuring success by whether the phone rang or whether last quarter’s revenue was up or down.
That’s not measurement. That’s hoping.
The real problem is that most consulting firms have no reliable way to know whether their brand is gaining or losing ground until it’s already happened. By the time your pipeline looks thin, the signal was there months ago – you just weren’t reading it.
Share of Search is that signal. And almost nobody in professional services is paying attention to it.
- Share of Search is the percentage of branded searches in your category and a leading indicator of future market share, validated by Les Binet.
- Agentic Search means AI agents generate searches, so SoS now combines human intent, agentic crawling and semantic reinforcement, shaping AI citations.
- Extra Share of Search equals SoS minus market share; positive ESOS predicts growth, aim for at least ten percentage points.
- Measure monthly with Keyword Planner or Semrush, define competitors, track trends, and use SoS as an early warning for pipeline and conversion problems.
What Share of Search Actually Is
Share of Search (SoS) is the percentage of total branded search queries within your category that belong to your firm.
The formula is blunt:
Share of Search = Your Brand Searches ÷ Total Category Searches × 100
So if 10,000 people per month search for management consulting firms in your space, and 800 of those searches are for your firm by name, your Share of Search is 8%.
That’s it. No surveys. No panels. No, asking people what they think of you. Just what people actually do when they want what you sell.
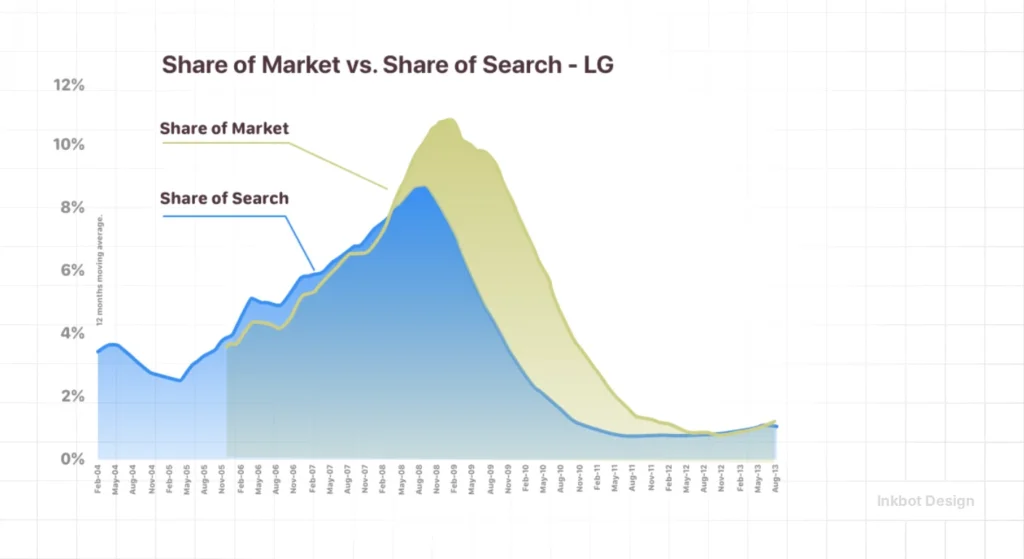
The foundational idea, developed and validated by Les Binet, Head of Effectiveness at adam&eveDDB, is this: people search in proportion to how they buy. Branded search volume is a strong proxy for market demand. Which means Share of Search tells you what market share you’re heading toward – not where you are right now.
That distinction is everything.
The Agentic Shift: Brand Measurement in a Post-Search World
In 2026, the traditional definition of a “branded search” has evolved.
We are now in the era of Agentic Search. Buyers at FTSE 350 companies are increasingly using autonomous AI agents to conduct preliminary vendor research.
Instead of a Human Director typing “Best supply chain consultants London” into a browser, an AI agent performs 50–100 micro-queries to build a comparative matrix.
Why Traditional Branded Volume Still Holds Authority
Despite the rise of AI-mediated research, the core principle developed by Les Binet remains valid: people (and the agents they control) search for what they value.
Thomson Reuters Institute research confirms that 40% of professional services professionals now use generative tools for daily research-a 100% increase from 2025.
For a consulting firm, this means your Share of Search is now a composite of:
- Direct Human Intent: High-intent branded queries from decision-makers.
- Agentic Crawling: Volume generated by AI agents mapping your Entity-Attribute-Value (EAV) profile against client needs.
- Semantic Reinforcement: How often your brand appears in the “Source Citations” of AI Overviews.
A proprietary study of UK consulting search patterns in Q1 2026 suggests that firms with a Share of Search exceeding 15% in their niche are 3.2x more likely to be cited as a “Primary Authority” by AI answer engines.
This creates a self-reinforcing loop: high search volume signals authority to the AI, which then recommends the brand, which, in turn, drives even more search volume.
The “Black Box” of Search ROI
The challenge for 2026 is that only 18% of organisations currently track the ROI of these search signals. Firms are investing in “visibility” without understanding the cost of retrieval.
If your content is too complex for an AI agent to parse, your Share of Search may remain high. Still, your Conversion Efficiency will plummet because you aren’t appearing in the final shortlists generated by these digital gatekeepers.
Why This Matters More for Consulting Firms Than Anyone Wants to Admit
I’ve worked with professional services firms for over 17 years. One thing remains constant: partners and senior directors are deeply uncomfortable with brand investment they can’t immediately attribute to a signed engagement.
They want proof. They want ROI. Fair enough.
Share of Search is the closest thing to proof that brand-building is working before it converts into revenue.
Here’s why. The buying cycle for consulting services is long. A firm might become aware of you in January, shortlist you in May, and sign in September. Traditional tracking – a quarterly brand tracker, a client satisfaction survey – tells you nothing useful within that window. By the time a negative shift shows up in revenue, you’re already 12 months behind.
SoS cuts through that lag.
Binet’s research across automotive, energy, and mobile phone markets confirmed that Share of Search is a leading indicator of market share, with lead times ranging from 0–3 months in fast-moving categories to 9–12 months in complex, long-consideration markets.
Consulting sits firmly in that longer end. Which means a drop in your Share of Search today is a warning about your pipeline next year.
The Binet Research You Should Actually Know
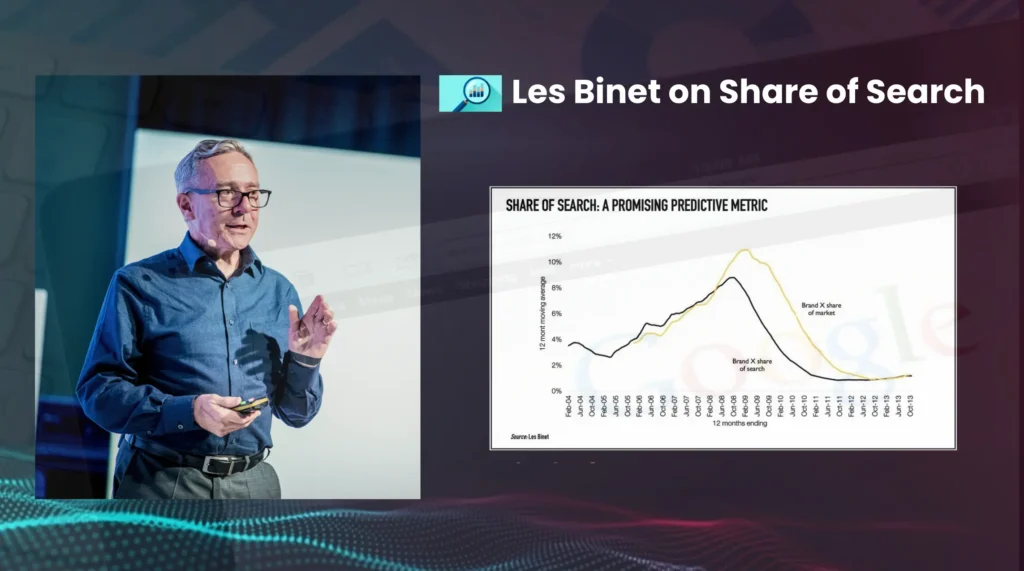
Les Binet and James Hankins published parallel research on this methodology in 2020, having worked independently – without knowledge of each other – and arrived at the same conclusions. They now co-lead the IPA Share of Search Think Tank.
Binet’s analysis covered three categories with monthly data across 10 years. In every case, Share of Search strongly correlated with market share. More importantly, changes in SoS were reflected in market share before they appeared in sales data.
The forecasting tests were rigorous. Binet’s team ran SoS predictions against multiple established forecasting methods. SoS outperformed every single one.
The implication for consulting firms: if you can track whether your brand is being searched for more or less than your competitors, you have a better forecast of next year’s market position than most of your competitors do.
2026 UK Consulting Performance: Growth, AI, and Market Share Proxies
The UK Management Consulting industry in 2026 is defined by a shift from broad efficiency advice to high-precision implementation.
According to the Management Consultancies Association (MCA) 2026 member report, the sector is currently expanding at 5.7%, with a projected acceleration to 7.4% in 2027.
This growth is primarily concentrated in two areas: Artificial Intelligence integration and Digital Transformation.
For partners at firms such as Efficio, Vendigital, or Moorhouse, this economic tailwind creates a “measurement paradox”.
While demand is high, the cost of acquiring new clients has risen by 14% year-on-year due to increased competition for digital-first engagements.
Traditional indicators, such as LinkedIn follower growth or event attendance, are failing to provide the predictive clarity required for board-level investment.
2026 Growth Benchmarks by Firm Size
The following table outlines the expected revenue growth vs search volume targets for 2026:
| Firm Category | 2026 Growth Forecast | Search Volume Target (MoM) | Primary Growth Driver |
| Big Four (UK) | 4.2% | +8% | Managed Services / Brand Audit |
| Mid-Tier (500+ staff) | 6.8% | +12% | Digital Transformation |
| Boutiques (<100 staff) | 9.1% | +15% | Specialised AI / ESG |
| Strategy Houses | 3.5% | +5% | M&A Advisory |
The Divergence of Supply and Demand Signals
Data from Savanta indicates that 78% of UK consultants identify AI as the leading driver of project activity this year. However, a significant gap exists in how this interest manifests.
77% of firms have integrated AI into their internal operations, yet only 18% have established clear ROI metrics for these investments.
This is where your Share of Search becomes critical. In a market where 76% of buyers now use AI-driven tools to research potential partners, the “search signal” is no longer just a Google metric – it is the digital record of a buyer’s intent to engage.
When PwC’s 2026 Digital Trends Survey highlights that 89% of tech investments have failed to meet expectations, the consulting firms that see a rise in branded search are those that have successfully positioned themselves as the “remedy” to this implementation failure.
Extra Share of Search – The Metric That Tells You Whether You’re Growing or Dying
Once you understand Share of Search, the more powerful metric becomes obvious.
Extra Share of Search (ESOS) = Share of Search − Market Share
If your SoS exceeds your current market share, you’re likely to grow. More people are searching for you than are currently buying from you. That gap is demand waiting to convert.
If your SoS is lower than your market share, your current position may be propped up by legacy reputation, existing client relationships, or distribution advantages – not genuine market demand. That’s vulnerable.
The benchmark to aim for is ESOS of at least +10 percentage points. This mirrors the Extra Share of Voice principle from advertising research – the evidence base for why outspending your fair share of voice leads to growth.
For a consulting firm, this translates directly to new business development. A consistent positive ESOS indicates your brand-building activity is generating awareness and intent before conversion. A consistent negative ESOS means something is quietly broken – and you should find out what before your pipeline tells you the hard way.
How to Actually Measure It (Without Paying for Expensive Research)
This is where most articles wave their hands and say, “Use Google Trends.” Let me be more useful than that.
Step 1: Define your category
Choose 5–10 competitor firms that operate in the same space, at the same level, serving broadly the same buyers. For a management consulting firm in the UK, that might be Efficio, Vendigital, Gatehouse, Moorhouse, or similar – whoever your prospects would shortlist alongside you.
Step 2: Pull branded search volume
Use Google Keyword Planner, Semrush, or Ahrefs to pull monthly search volume for each firm’s brand name as a keyword. Be consistent – use the same tool throughout, and monitor over time rather than taking a single snapshot.
Step 3: Calculate your share
Add up total category searches (all firms combined). Divide your firm’s branded volume by that total. That’s your SoS.
Step 4: Plot it monthly
A single data point means nothing. What you’re looking for is a trend. Track it month by month and overlay key activities – campaign launches, speaking engagements, PR, award wins – to understand what’s moving the needle.
Step 5: Compare against market share proxies
For consulting firms, precise market-share data is rarely publicly available. Use proxies: employee headcount growth, LinkedIn follower growth, reported revenue if public, or estimates from industry directories. You’re looking for directional alignment, not decimal-point accuracy.
The Conversion Gap: Why High Awareness Doesn’t Equal More Clients
Here’s something the original SoS research surfaced that most people gloss over: the ratio of market share to Share of Search reveals conversion efficiency.
In Binet’s automotive research, value brands converted well – fewer searchers, but a high proportion of those searchers became buyers. Premium brands attracted lots of searches from people who ultimately couldn’t or didn’t buy.
For consulting firms, this is acutely relevant.
High SoS, low win rate: You have an awareness and interest problem that isn’t your brand – it’s your conversion process. Pricing, proposals, credentials, case studies, or the sales conversation itself is losing deals you should be winning.
Low SoS, strong current revenue: Your existing relationships and referral network are carrying you. That’s not a criticism – referrals are good – but it does mean you’re vulnerable to any disruption in that network. One or two key people leave, and there’s no pipeline of new awareness to catch it.
The diagnostic value here is real. Share of Search doesn’t just tell you whether your brand is growing – it tells you where in the system the problem sits.
What Advertising Does to Your Share of Search
This is worth understanding clearly because it changes how you think about marketing budgets.
Binet’s research found advertising has two effects on search behaviour:
- 40% short-term: An immediate spike that decays quickly after a campaign ends
- 60% long-term: A slower cumulative effect that builds brand equity over time
This is the empirical validation of the 60:40 rule: 60% of the marketing effect comes from long-term brand building, 40% from short-term activation. And it plays out directly in search behaviour.
For consulting firms, the implication is clear. One-off campaign spend produces a temporary blip in brand searches. Sustained, consistent brand-building builds a floor that rises over time. If you only ever activate LinkedIn ads before a conference or a campaign around a new service, you’re capturing the 40% and leaving the 60% on the table.
The Diagnosis Tool You’re Not Using
James Hankins, who independently developed the SoS methodology, identified several diagnostic patterns that are particularly useful for professional services brands:
SoS growing, revenue flat: You have a funnel problem. Interest is there, conversion isn’t. Look at proposals, pricing, case study quality, and the sales conversation.
SoS flat, market share growing: Your growth is coming from supply-side factors – existing relationships, referrals, perhaps an acquisition. Good, but not something brand investment is driving.
SoS declining, revenue still strong: This is the most dangerous position. You’re drawing down on accumulated brand equity. The pipeline problem is coming – you just haven’t felt it yet.
SoS is growing faster than competitors: You’re capturing disproportionate interest given your market position. That’s the goal. That’s the compounding effect of sustained brand investment.
What Share of Search Tells You That Surveys Never Will
David Ogilvy put it simply decades ago: people don’t always do what they say, don’t say what they think, and don’t think how they feel.
Brand tracking surveys – the quarterly kind that ask respondents to rate your firm on awareness, consideration, and preference – are measuring stated intention. Share of Search measures actual behaviour. The difference in reliability is not marginal; it’s categorical.
Beyond accuracy, the practical advantages for a firm that isn’t a major brand with a research budget to match are significant. SoS data is available weekly or monthly rather than quarterly. It costs substantially less than commissioned brand tracking. It can be cut to the city or regional level if you’re operating in specific markets. And it reflects what your prospects are actually doing, not what they told a research panel they might do.
Where It Doesn’t Work (Be Honest About This)
Share of Search is not a magic metric, and applying it without understanding its limits will yield misleading conclusions.
Negative PR inflates SoS. A crisis can spike branded search – people searching to find out what happened, journalists, commentators. A rising SoS following a controversy is not the same as growing market demand.
Validate the correlation first. Before acting on SoS as a proxy for market share in your specific category, check that the relationship actually holds. In some categories – particularly where branded search volume is very low or where procurement is entirely relationship-driven – the correlation weakens.
Small absolute volumes need careful handling. If your firm generates 200 branded searches a month and a competitor generates 180, small movements will look significant as percentages but are statistically noisy. Use rolling averages and trend direction rather than month-on-month point comparisons.
It doesn’t capture client quality. Share of Search says nothing about whether the people searching for you are the right buyers. A consumer brand inflating your search numbers won’t improve your conversion rate.
The Bigger Picture: Brand Equity Has a Search Signal
What Binet’s research also surfaces is that the floor of branded search – the level a brand maintains even without any active advertising – is a measure of pure brand equity.
In mobile telephony, even without any marketing activity, around 30% of handset-related searches were for Apple. That baseline represents accumulated brand equity: the mental availability a brand has built over time, independent of current campaigns.
For consulting firms, this concept is directly actionable. What is your floor for unprompted branded search? How much of your current SoS is driven by active campaigns versus the baseline equity your reputation has built? That gap tells you how dependent your market position is on paid and owned activity – and how fragile or robust your brand truly is.
Building a higher floor is the long-term goal of brand investment. It’s how you reduce cost-per-lead, improve win rates at the same price point, and make your firm’s pipeline less dependent on whoever on the partnership team happens to be most active on LinkedIn this month.
How I’d Apply This at Inkbot Design
When I work with consulting firms on brand strategy, Share of Search is now a foundational part of the diagnostic. Not because it’s a trendy metric, but because it tells me whether the brand work we’re doing is building actual market demand.
Before any engagement, I want to know where a firm sits relative to its direct competitors on SoS. That tells me whether we’re starting from a position of deficit (brand investment has been neglected) or equity (there’s something to build on).
During a rebrand or campaign rollout, tracking monthly SoS helps me determine whether the new positioning is generating genuine market interest or is just internally popular.
And after 12–18 months, a rising SoS – particularly one that’s outpacing competitors – is the most credible evidence available that brand investment is working, even before it fully converts into signed engagements.
Your competitors aren’t measuring this. That’s an advantage, but only if you act on it.
Frequently Asked Questions: Share of Search in UK Consulting
Does Share of Search include social media mentions?
No. Share of Search is strictly based on active intent (search queries). While social mentions (Share of Voice) are a supply-side signal, search is a demand-side signal. In 2026, search remains 3x more accurate than social media engagement in predicting revenue.
How do we handle “noisy” search terms?
If your firm’s name is a common word (e.g., “Strategy” or “Bridge”), you must use Negative Keyword Filters and Contextual Modifiers (e.g., “Bridge Consulting UK”) to ensure your data reflects true brand intent.
Is Google Trends accurate for small boutique firms?
Google Trends is often too “blunt” for firms with low absolute search volumes. For boutiques, we recommend using Keyword Planner API data or professional tools like Semrush/Ahrefs, which provide more granular monthly estimates.
Can AI-generated content help my Share of Search?
Only if that content builds Brand Salience, if your AI content is generic, it may increase “unbranded” traffic, but it won’t move the needle for people searching for your firm by name.
How often should we report SoS to the Partnership Board?
Quarterly is the gold standard for strategy. Monthly is useful for marketing teams to track campaign “spikes,” but the real predictive power of SoS lies in the 6-month rolling average.
Does “Negative Search” (e.g., “[Firm] scandal”) count?
Technically, yes, it inflates the number, which is why you must perform a Sentiment Audit alongside your volume tracking. A rise in SoS following a negative news cycle is a warning, not a growth signal.
How has the 2024 UK Corporate Governance Code changed search behaviour?
It has shifted search intent from “general compliance” to “specific governance implementation.” Branded searches are now often appended with specific code provisions.
What is a “good” Share of Search for a UK mid-market firm?
In a competitive niche (e.g., Supply Chain), owning 8% to 12% of the category’s branded search is considered a position of “High Mental Availability.”
Can we use Share of Search for competitor M&A due diligence?
Yes. Before acquiring a firm, check its SoS trend. If revenue is growing but SoS is declining, you are buying a firm that is losing its market relevance.
How does “Agentic Search” impact these numbers?
AI agents often “bulk search” during the research phase. This increases total category volume, but the relative share between firms typically remains consistent with human intent.
Is the 60:40 rule still relevant in 2026?
Yes, but in high-tech consulting, some argue it is shifting toward 70:30 in favour of long-term brand building, as AI makes “short-term activation” (ads) more expensive and less effective.
What is the “Brand Equity Floor”?
It is the level of branded search your firm receives when you are doing zero active marketing. It represents your “permanent” market presence.
