How to Read Your Ecommerce Analytics Without Losing Your Mind
Most of what people call “ecommerce analytics” is a complete and utter waste of time. It’s a pointless fetishisation of data. It is a corporate-inspired pantomime where entrepreneurs click through colourful dashboards, nod sagely at rising charts, and feel productive, all while their business slowly bleeds out.
You’re told you need to be “data-driven.” You’re selling complex tools that promise to “unlock insights.” You build reports. You track dozens of metrics.
The result? You’re drowning. You have more information than ever and less clarity than when you started.
My promise here isn’t to show you another chart. It’s to hand you a scalpel and show you where to cut. Let’s eliminate the noise and find the numbers that make you money.
- Focus on key metrics: Conversion Rate, Average Order Value, and Customer Lifetime Value for sustainable business growth.
- Vanity metrics can mislead: prioritise actionable insights over flashy but meaningless numbers.
- Regularly analyse data: conduct weekly health checks and monthly deep dives for effective decision-making.
- Branding is crucial: a strong brand affects trust, conversion rates, and overall business performance.
The Big Lie: Why Your “Data-Driven” Approach is Failing
The problem isn’t you. It’s the culture that has grown up around data. A culture that values the appearance of intelligence over actual commercial results. It’s a lie that costs small businesses a fortune.

Vanity Metrics: The Silent Killer of Small Business
The most lethal part of this lie is the worship of vanity metrics.
These numbers look great on a PowerPoint slide but mean nothing for your bottom line. Traffic. Sessions. Page views. Social media likes. Follower counts.
They are the business equivalent of candy floss—a fleeting sugar rush of ego with zero nutritional value.
I once had a client, a founder of a fashion brand, who was ecstatic. They’d just passed 100,000 followers on Instagram, and their web traffic was high. They wanted to celebrate. I asked to see their profit and loss statement. The mood changed. Their customer acquisition cost was astronomical, and their profit margin was razor-thin. They were going broke while looking successful.
The real cost of chasing vanity metrics isn’t just the ego trip. It’s the catastrophic misallocation of your two most precious resources: time and money. Every hour and every pound you spend trying to boost your session count is an hour and a pound you didn’t spend improving your checkout process.
The Curse of a Thousand Dashboards
The second part of the lie is that a new tool will solve your problems.
You get a free trial for some whiz-bang analytics platform. It connects to everything. Suddenly, you have heatmaps, session recordings, funnel visualisations, and a dashboard that looks like a stock trader’s nightmare.
And you do nothing.
It’s the paralysis of analysis. You’re so overwhelmed by the sheer volume of information that you can’t possibly decide what to do first. So you put it off. You go back to checking your daily traffic numbers because it’s easy.
Stop looking for a solution in a software subscription. The goal isn’t more information. It’s insight. And insight doesn’t come from a dashboard but from asking the right questions.
The Only Ecommerce Metrics That Actually Matter
Right. Enough moaning about the problem. Let’s talk about the solution.
You don’t need to track 50 metrics. For most small businesses, you must have an iron grip on about five. The rest is mostly noise. You have a real business if you can track, understand, and influence these.
The Holy Trinity: The Three Numbers You MUST Know
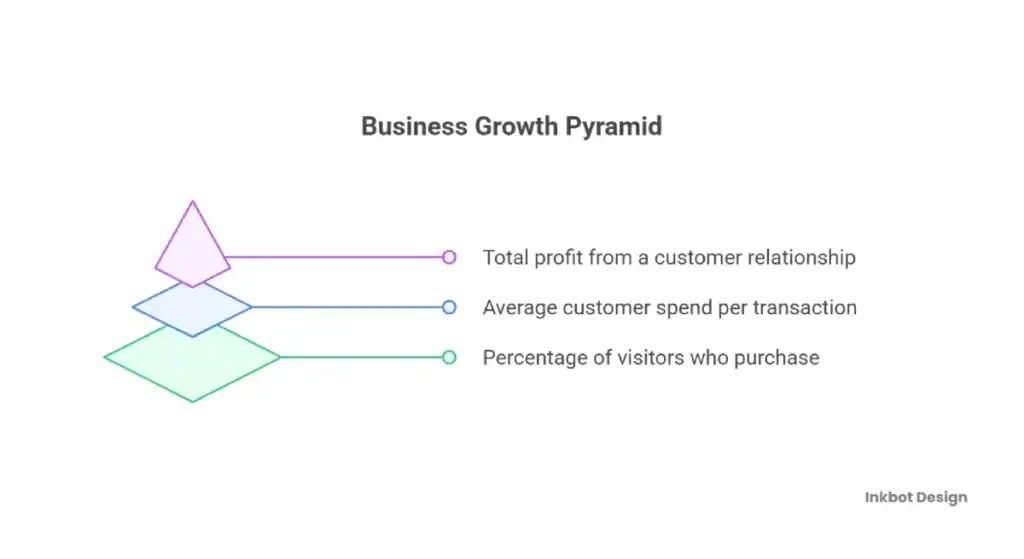
These three work together. Improving any one of them will grow your business. Improving all three is how you build an empire.
1. Conversion Rate (CR) This is the percentage of visitors who purchase. It’s the most critical measure of your store’s health. It tells you how persuasive your offer is, how good your product pages are, and how little friction there is in your checkout. A low conversion rate is a sign that something, somewhere, is broken.
2. Average Order Value (AOV) This one’s simple: how much does the average customer spend in a single transaction? It costs you the same amount to acquire a customer whether they spend £20 or £200. Getting them to spend more is one of the fastest ways to increase your revenue and, more importantly, your profit.
3. Customer Lifetime Value (CLV) This is the big one. It’s the total amount of profit you can expect to make from a single customer over the entire course of their relationship with you. A business obsessed with one-off sales is a business that is constantly, expensively, looking for new customers. A company focused on CLV builds relationships, encourages repeat purchases, and creates sustainable, long-term wealth.
The Cost of Doing Business: CAC and Profit Margin
The Holy Trinity tells you what’s coming in, and these next two tell you what it’s costing you.
Customer Acquisition Cost (CAC): What does it cost to get one new person to click ‘buy’? This isn’t just your ad spend. It’s your ad spend, the marketing team or agency, and the cost of any software you use. You need to be brutally honest with this number.
The most dangerous equation in ecommerce is CAC > CLV. If it costs you more to acquire a customer than they will ever be worth, you are not running a business. You are running a costly hobby.
Profit Margin I shouldn’t have to say this, but I do. Revenue is vanity, and profit is sanity. Who cares if you have a turnover of £1 million if your profit is £10,000? You must know your actual profit margin on every product after all costs are considered—the cost of goods, shipping, transaction fees, and marketing. This is the ultimate truth-teller.
The Leaks in Your Bucket: Diagnosing Problems
If the metrics above are your business’s vital signs, these next few are the diagnostic tools you use when things look off.
- Cart Abandonment Rate: What percentage of people who add an item to their cart leave without buying? This is the lowest-hanging fruit in ecommerce. A high rate (and anything over 70% is worth investigating) points to a problem in your checkout. Usually, it’s a surprise shipping cost.
- Bounce Rate (with a caveat): The percentage of visitors who land on a page and leave without doing anything else. A high bounce rate on a product page could mean the price is wrong; the description is weak, or the traffic you’re sending there is irrelevant. However, a high bounce rate on a blog post might mean they read it and got what they needed. Context is everything.
- Top Exit Pages: Look at your analytics. Find the pages where most people leave your site. Is it your homepage? A specific product category? The shipping information page? These are the points of friction. These are the pages that need fixing first.
A Simple Framework for Analysing Your Ecommerce Data
You don’t need to live inside Google Analytics. That’s my job. Your job is to dip in, get the answers you need, and get out so you can work on your business.
Here’s a simple rhythm.
Step 1: The Weekly Health Check (15 Minutes Max)
Once a week, on Monday morning, with your coffee, open your analytics and check four things. That’s it. Don’t get distracted.
- Overall Conversion Rate: Is it trending up or down compared to last week?
- Traffic & Sales by Channel: Where did the sales actually come from? Not the clicks, the sales. Did your email campaign work? Is that Facebook ad pulling its weight?
- Top 5 Selling Products: What’s working? Can you push it harder?
- Top 5 Underperforming Products: What’s not? Is it time to discount it or kill it off?
This 15-minute check prevents you from flying blind. It’s your early warning system.
Step 2: The Monthly Deep Dive (The “Why” Session)
Once a month, block out an hour. Now, you’re not just looking at what happened; you’re asking why.
You’re looking at the customer journey. You’re comparing new customers to returning customers. Do returning customers spend more? Do they convert at a higher rate? (If not, your post-purchase experience is failing.)
You’re properly attributing your marketing. Did that blog post you wrote three months ago finally start generating sales? You’re looking for patterns, not just numbers.
An Observation on Branding’s Invisible Hand
Here’s something the spreadsheets will never tell you.
Analytics can show you what is happening. They can tell you your conversion rate is low. But they can’t always tell you why. Often, the ‘why’ isn’t a technical issue. It’s a brand issue.
A high bounce rate isn’t just a “landing page optimisation” problem. It could be a trust problem. People land on your site, which looks amateurish and untrustworthy, so they leave immediately. A low AOV might not be a cross-sell problem but a perception problem. Your brand doesn’t feel premium enough to justify a higher spend.
Your brand identity is the invisible hand that guides every metric you track. A strong, professional brand builds instant trust, pre-qualifies your visitors, and makes them want to buy from you. It simplifies your analytics because you’re dealing with the right people from the start. If your numbers are consistently poor despite a good product, the first place you should be investing isn’t in a new analytics tool but in your brand.
Common, Expensive Mistakes in Ecommerce Analytics
I see the same mistakes over and over again. They are simple to understand and simple to fix, yet they cost businesses millions.
Mistake 1: Blaming the Ad, Not the Offer
Entrepreneurs love to obsess over their ads. They tweak the copy, change the creative, and spend hours agonising over the Return on Ad Spend (ROAS).
Look, ROAS is essential. But it’s only half the story. The user’s journey doesn’t end when they click the ad. That’s when it begins. You can have the best ad in the world, but you’ve wasted your money if it sends people to a slow, confusing, or ugly landing page.
Stop blaming the ad. Start scrutinising what happens after the click.
Mistake 2: Ignoring Device Segmentation
Check your website on your nice, big desktop monitor. It looks great.
Have you tried completing a purchase on your site using a three-year-old phone on a patchy 4G connection? Because that’s how a massive chunk of your customers are experiencing it.
Mobile commerce now accounts for most online sales, yet mobile conversion rates consistently lag behind desktop. Why? Because too many stores are a nightmare to use on a small screen. You need to look at your conversion rate by device. If your mobile conversion rate is half your desktop rate, you don’t have an analytics problem—you have a user experience disaster.
Mistake 3: Treating All Traffic Equally
This is a fundamental error. Imagine two visitors.
- Visitor A searched Google for your exact brand name. They already know you, trust you, and want to buy from you.
- Visitor B clicked a link in a TikTok video from an influencer. They’ve never heard of you and are only vaguely curious.
To lump these two visitors into a single “traffic” number is madness. Their intent is entirely different. Their likelihood to convert is worlds apart.
You must analyse your data using a traffic source or channel. It will tell you which channels bring you browsers and which bring you buyers. Focus your energy on the latter.
The “Successful” Campaign That Lost Money
I worked with a business that was about to pop the champagne. Their marketing agency had just run a massive campaign that drove 500,000 new visitors to their site in a month. The traffic chart was a beautiful, near-vertical line. The board was delighted.
Then, I overlaid the sales data. And the profit data. The campaign had a conversion rate of 0.01%. They had spent £50,000 on ads to generate £4,000 in revenue, which resulted in about £800 of profit.
The agency got a bonus for hitting their traffic “KPIs”. The business was £49,200 poorer. Don’t be that business.
The Right Tools for the Job (Hint: They’re Probably Free)
Everyone wants to know the “secret” tool—the magic platform. There isn’t one. The secret is learning how to use the basic tools properly.
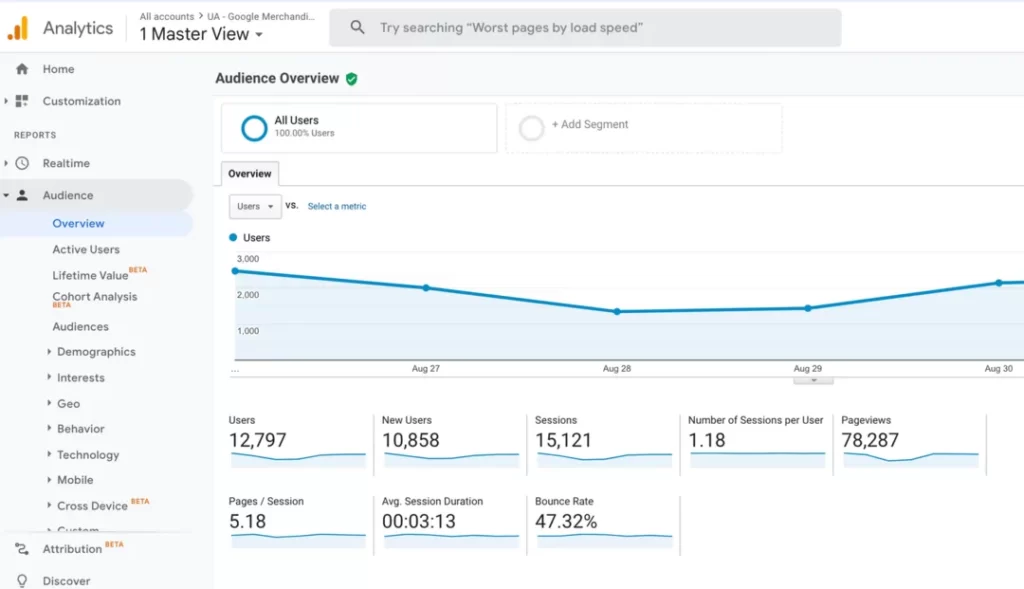
Google Analytics 4: The Beast You Need to Tame
Google Analytics 4 is immensely powerful and a bit of a mess. It’s easy to get lost.
So don’t.
You need to live in three or four key reports. That’s it.
- Traffic Acquisition: Where are your users coming from?
- Engagement -> Pages and screens: Which pages are people actually looking at?
- Monetisation -> Ecommerce purchases: Which products are selling?
The most important thing you must do is set up conversion tracking. If your analytics platform cannot see your sales, it is a glorified visitor counter and useless. Setting this up is not optional.
Your Ecommerce Platform’s Built-in Analytics (Shopify, WooCommerce, etc.)
The analytics dashboards inside Shopify, BigCommerce, or WooCommerce are brilliant for one thing: quick, top-level numbers.
They are perfect for your 15-minute weekly health check. They give you sales, AOV, and top products at a glance. They are fast, convenient, and usually accurate.
Where do they fall short? They can’t tell you much about user behaviour before the sale. They don’t have the deep-dive data on traffic sources or on-site engagement that Google Analytics does. Use them for what they are: a convenient snapshot, not a deep analytical tool.
When (and If) You Should Pay for an Analytics Tool
For 90% of the people reading this, the answer is simple: not yet.
Paying for a specialised analytics tool like a Triple Whale or a Glew before you understand the free tools is like a learner driver buying a Formula 1 car. It’s an expensive way to crash.
You should only consider paying for a tool when:
- You have a high volume of orders (hundreds per day).
- You are running complex marketing funnels across many different channels.
- You have a dedicated person (not you, the founder) whose job is managing and interpreting the data.
Until then, save your money.
From Insight to Action: What To Do With The Numbers
Data is useless unless it leads to action. Here’s a simple cheat sheet.
If Your Conversion Rate is Low…
- Investigate: Your product pages. Are the images high-quality? Is the copy persuasive? Is the ‘Add to Cart’ button obvious? Then, scrutinise your checkout process. Go through it yourself. Is it long? Does it ask for useless information? Are there surprise shipping costs?
- Action: A/B test a new product description. Offer free shipping over a certain threshold. Remove unnecessary fields from your checkout form. Small changes here have huge effects.
If Your AOV is Stagnant…
- Investigate: Are you giving customers easy opportunities to spend more? Are you suggesting relevant products? Are you offering bundles?
- Action: Create product bundles that offer a small saving (e.g., “Buy the shampoo and conditioner together and save 10%”). Implement a “You might also like…” section on your product pages that is genuinely helpful. Offer a small, relevant add-on item in the cart.
If Your CLV is Poor…
- Investigate: What happens after someone buys? Do they just get a generic receipt and then be silent? Are you asking for feedback? Is the product living up to its promise?
- Action: Develop a simple email welcome series for new customers. Send a follow-up email a few weeks later asking for a review. Create a simple loyalty program that rewards repeat business. Make your customers feel seen and appreciated.
Stop Searching for Magic
Stop looking for a magic bullet in your data. The numbers are just a reflection of the truth. They aren’t the truth itself.
The magic is in your product. It’s in your brand. It’s in your deep, intuitive understanding of your customer’s problems and desires.
Your job as an entrepreneur isn’t to become a data scientist. It’s to be a business owner who uses data to ask better questions and make smarter decisions.
Focus on the few things that matter. Ignore the rest. Now, go and work on something that will grow your business.
Get It Done
We spend our time observing what makes brands work. If these observations are helpful, you’ll probably enjoy our other articles. If you’ve looked at your numbers and realised the problem isn’t your ads but a brand that fails to connect or build trust, that’s what we fix.
You can see our approach to brand identity here. If you’re ready to have a direct conversation about your own business, request a quote here.
Frequently Asked Questions (FAQs)
What are the three most crucial ecommerce analytics metrics?
The three most critical metrics are Conversion Rate (CR), Average Order Value (AOV), and Customer Lifetime Value (CLV). Mastering these gives you a comprehensive view of your store’s health and profitability.
How often should I check my ecommerce analytics?
Perform a quick 15-minute “health check” once a week to monitor key trends. Reserve a longer, one-hour “deep dive” session once a month to ask “why” and analyse customer behaviour and marketing performance.
What is a reasonable conversion rate for an ecommerce store?
This varies wildly by industry, price point, and traffic source. A standard benchmark is between 1% and 3%. Instead of chasing a specific number, consistently improve your conversion rate month-over-month.
How can I reduce my cart abandonment rate?
The most common culprit is unexpected costs at checkout, especially shipping fees. Be transparent about all costs upfront. Other strategies include simplifying the checkout process, offering guest checkout, and using exit-intent popups with a small discount.
What’s the difference between CLV and AOV?
Average Order Value (AOV) is a customer’s average amount in a single purchase. Customer Lifetime Value (CLV) is the total profit you expect from that customer over their entire relationship with your brand. CLV is a far more critical metric for long-term strategy.
Is high traffic a good thing if my sales are low?
No. High traffic with low sales is a sign that you are attracting the wrong audience, your on-site experience is poor, or your product/offer is not compelling. It’s a vanity metric that can mask serious business problems.
Do I need to pay for an expensive analytics tool?
For most small to medium-sized businesses, the answer is no. The combination of Google Analytics 4 and your ecommerce platform’s built-in reporting provides more than enough data. Only consider paid tools when you have a high volume of sales and a dedicated team to manage them.
What is Customer Acquisition Cost (CAC), and how do I calculate it?
CAC is the total cost of sales and marketing to acquire a new customer. To calculate a basic CAC, divide your total marketing and sales spend over a specific period by the number of new customers acquired in that same period.
Why is it important to analyse data by traffic source?
Not all traffic is created equal. A visitor from a branded Google search has a much higher intent to buy than a visitor from a social media ad. Analysing sales and conversion rates by source tells you which marketing channels are profitable, allowing you to invest your budget more effectively.
My analytics look fine, but my business isn’t growing. What’s wrong?
Analytics show the “what,” not always the “why.” The issue is often qualitative if your numbers are okay, but growth is stagnant. It could be weak branding, poor customer perception, a competitor’s new offer, or a decline in product-market fit. This is when you must look beyond the data and your brand strategy.
What is the first thing I should fix based on my analytics?
Look for the most significant leak. This is often the cart abandonment rate. Fixing a checkout process that loses 7 out of 10 potential customers is the fastest way to increase revenue with your existing traffic.
How does branding affect my ecommerce analytics?
A strong brand builds trust, which directly impacts your conversion rate. It creates preference, which impacts customer lifetime value. It justifies a premium price, which affects your average order value and profit margins. Good branding is a force multiplier for every metric you track.


Smart breakdown—ecommerce analytics isn’t just data collection, it’s about tracking the metrics that directly impact your bottom line. Monitoring average order value, cart abandonment, customer acquisition cost, lifetime value, retention, and conversion rate gives you clear signals on what’s working and where to double down. When you use these insights to optimize pricing, checkout flow, marketing spend, and customer loyalty, you’re turning raw numbers into real growth.