An SEO Guide to Infographics for Link Building
Attention, fellow link builders! Do you want to avoid spinning your wheels with ineffective strategies? Well, buckle up because I’m about to show you how to harness the power of infographics to skyrocket your link-building efforts.
I’ve been in the digital marketing game for over a decade. As the founder of Inkbot Design, I’ve seen firsthand how infographics can be a game-changer when building high-quality backlinks.
But don’t just take my word for it – let me share a personal story that’ll convince you.
Back in 2019, I was working with a client in the finance industry. They struggled to generate meaningful links, and their SEO was in shambles.
That’s when I had a lightbulb moment: “Why not create an infographic highlighting the key financial trends in their industry?”
I got to work crunching the numbers and designing a visually stunning infographic that was informative and eye-catching.
When we published it on their website, the results were remarkable. Within a few weeks, we secured over a dozen high-authority backlinks from industry publications, personal finance blogs, and major news outlets.
The client was ecstatic, and so was I. That’s when I realised the true power of infographics for link building. From then on, I’ve been evangelising this approach to anyone who listens. And today, I’m here to share my secrets with you.
- Infographics are highly shareable visuals that attract organic, high-authority backlinks and improve perceived credibility.
- Choose relevant, compelling topics and craft a cohesive narrative backed by data from credible sources like ONS or World Bank.
- Use a hybrid workflow: leverage Generative AI for assets and a human editor to verify statistics and storytelling.
- Atomise content into a Visual Bundle (hero graphic, stat-cards, carousels, short video) for social-first link building.
- Optimise and promote: compress images (AVIF <500KB), add alt text, schema, sources footer, and outreach to secure backlinks.
The Rise of Infographics: Why They’re a Link Builder’s Dream
In the ever-evolving world of digital marketing, the importance of link-building cannot be overstated.
Google and other search engines place significant emphasis on the quality and quantity of backlinks pointing to your website.
After all, the more high-authority sites link to you, the more credible and trustworthy your content appears.
But let’s be honest – traditional link-building tactics can be a real slog. Outreach, guest posting, and link reclamation can be time-consuming, tedious, and often yield disappointing results.
That’s where infographics come in.
Infographics are the perfect link-building weapon for a few key reasons:
- Visual Appeal: People are naturally drawn to visually compelling content. Infographics are a surefire way to capture the attention of your target audience and make your brand stand out from the sea of text-heavy content.
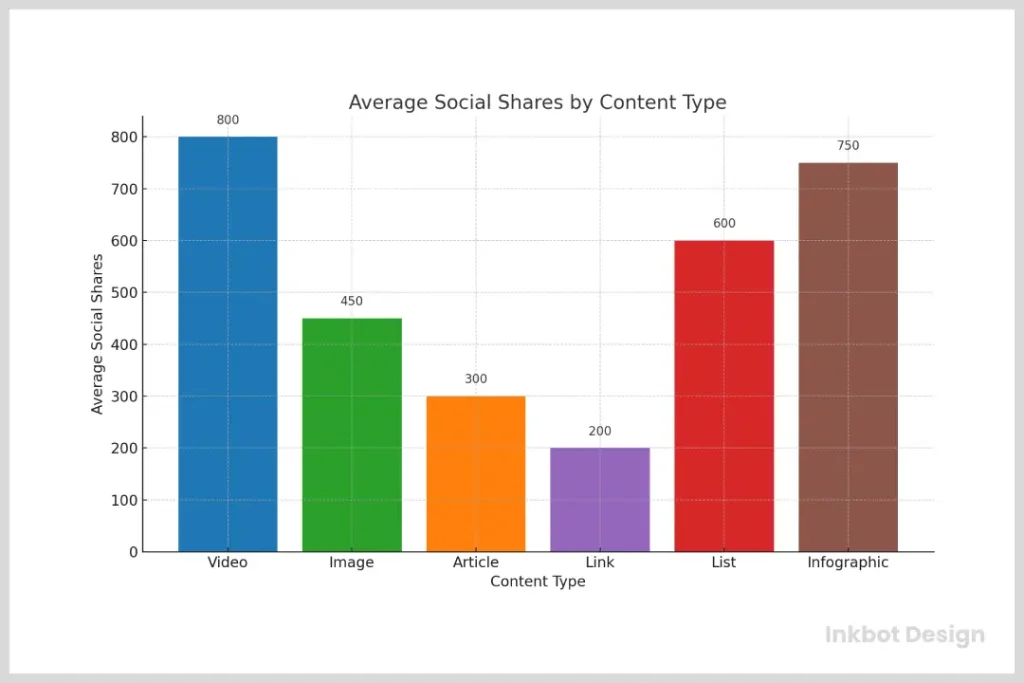
- Shareability: Infographics are highly shareable, making them likely to go viral and attract a ton of organic backlinks. When people see a visually stunning and informative infographic, they can’t help but want to share it with their friends, colleagues, and social networks.
- Relevance: By creating infographics relevant to your industry and target audience, you’re more likely to attract links from high-authority, industry-specific websites. These are the types of links that search engines love.
- Longevity: Unlike a one-off blog post or guest article, an infographic can continue to generate backlinks for months or even years after its initial publication. It’s the gift that keeps on giving!
So, if you’re ready to take your link-building efforts to the next level, it’s time to start harnessing the power of infographics.
But before you dive in, let me share a few more personal experiences that’ll inspire you to do the same.
The AI Revolution: Designing Linkworthy Visuals in 2026
The landscape of visual content changed forever with the integration of Generative AI.
You no longer need a month-long production cycle to create a masterpiece. By using a hybrid workflow, you can combine human strategy with AI efficiency to scale your link-building efforts.
The 2026 AI Visual Stack
To stay ahead, you should integrate these specific tools into your process:
- Midjourney & DALL-E 3: Use these for custom iconography and hero illustrations. Instead of stock photos that everyone has seen, generate unique, brand-aligned 3D renders or isometric art.
- Adobe Firefly: Perfect for “Generative Fill,” allowing you to expand a chart’s canvas or modify specific design elements without starting from scratch.
- Canva Magic Studio: Ideal for turning a single infographic into a dozen “micro-graphics” for different social platforms instantly.
When to Use AI vs Human Designers
While ChatGPT can help you brainstorm the narrative arc, it often hallucinates data. Always use a human editor to verify statistics from the Office for National Statistics or World Bank before committing them to pixels. Use AI for the “grunt work”—resizing, generating icons, and colour palettes—but keep a human eye on the data storytelling to ensure your infographic remains a credible source for journalists.
Infographics in Action: Real-Life Case Studies
As the founder of Inkbot Design, I’ve had the privilege of creating countless infographics for clients across various industries. And let me tell you, the results have been nothing short of remarkable.
Take, for example, our client in the fitness industry. They came to us because their blog content wasn’t generating the traction they hoped for. That’s when we suggested creating an infographic highlighting the year’s top fitness trends.
We got to work, crunching the data and designing a visually stunning infographic that was informative and shareable.
When we published it on their website, the results were immediate. Within a week, we secured backlinks from several high-authority fitness blogs and industry publications. And the best part? Those links are still driving traffic and boosting their SEO to this day.
But it’s not just the fitness industry that’s benefiting from the power of infographics. Last year, we worked with a client in the travel industry struggling to stand out in a crowded market. That’s when we had the idea to create an infographic highlighting the top eco-friendly travel destinations worldwide.
The infographic was a hit, with travel bloggers, sustainability advocates, and even major news outlets linking to our client’s website. And the best part? The infographic continued to generate backlinks for months, helping to solidify our client’s position as a thought leader in the industry.
These are just a few examples of the results you can achieve with infographics. And trust me, I could go on and on. But the bottom line is this: if you’re serious about taking your link-building efforts to the next level, infographics are the way to go.
Key Types of Infographics to Consider
Right, so you’re on board. Good.
But hold on a second, don’t just start throwing charts and icons onto a blank canvas.
The thing is, different kinds of information need different kinds of packaging. Choosing the right format is half the battle.
Here are a few solid types that get the job done:
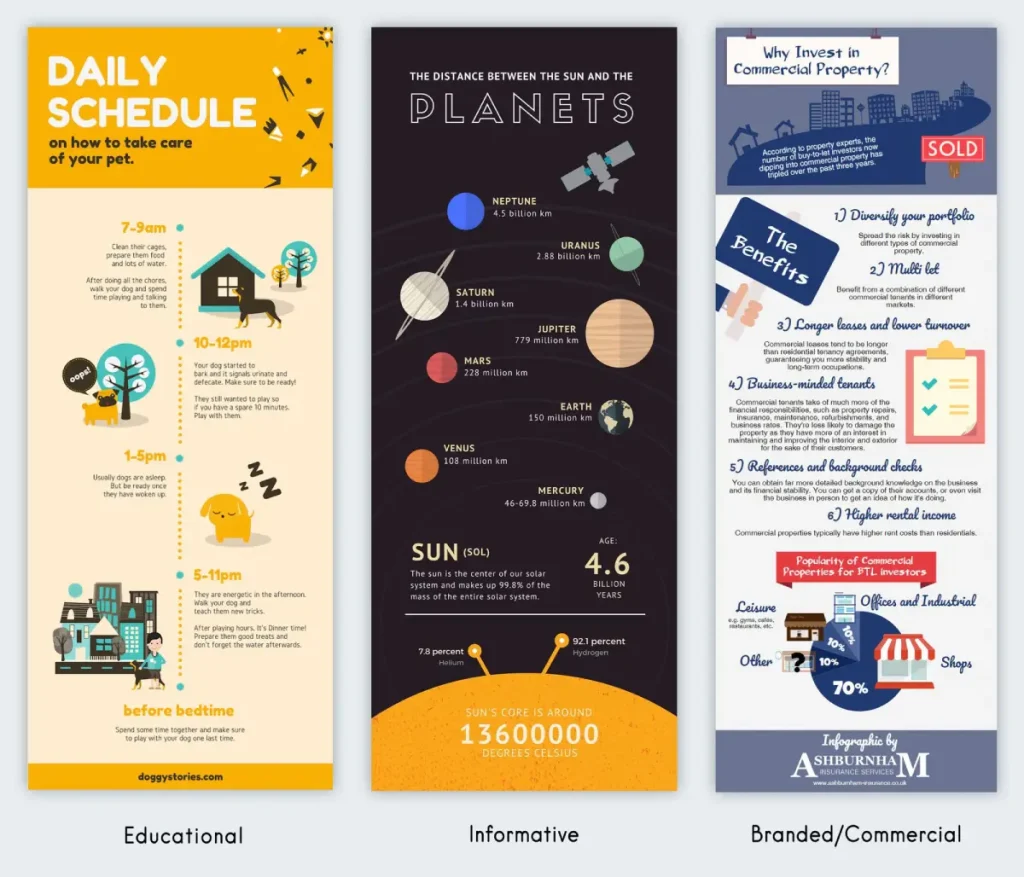
- Statistical Infographics: This is your bread and butter if you have hard data. Got survey results or a load of market research? Turn those numbers into charts and graphs. People love sharing a shocking statistic, and journalists love citing them. It makes you look like the expert.
- Informational (or List-Based) Infographics: Perfect for explaining a concept or giving tips. Think “7 Ways to…” or “A Beginner’s Guide to…”. You use icons and short snippets of text to make complex stuff dead simple to understand.
- Timeline Infographics: Want to show the history of your industry or how a product has changed over time? A timeline is your best mate. It lays everything out chronologically and tells a story that’s easy to follow.
- Process Infographics: These are basically “how-to” guides in visual form. They break down a complicated process into simple, numbered steps. Incredibly useful and shareable because they solve a direct problem for the reader.
- Comparison Infographics: Pitting two things against each other? This is the format. It’s a head-to-head breakdown that helps people decide between options. Think “Mac vs. PC” or “SEO vs. PPC”. They work because they help people make a choice.
Crafting Linkworthy Infographics: A Step-by-Step Guide
Okay, you’re convinced that infographics are the key to unlocking your link-building potential. But where do you even begin? Fear not, my friends – I’ve got you covered.
Here’s a step-by-step guide to creating infographics that are guaranteed to attract high-quality backlinks:
- Choose a Compelling Topic: The key to creating a successful infographic is to choose a topic that is both relevant to your audience and shareable. Think about the burning questions or pain points your target audience faces, and craft an infographic that provides a solution or insight.
- Conduct Thorough Research: Once you’ve chosen your topic, it’s time to start researching. Gather data, statistics, and insights from credible sources to ensure your infographic is accurate and informative.
And when I say “credible sources,” I mean it. Don’t just pull the first number you see from some random blog.
You need to go where the proper data lives. Look at government databases, such as the Office for National Statistics.
Their data is solid as a rock. For academic stuff, Google Scholar is your friend, and for industry trends, look at reports from big names like Gartner or Statista.
And don’t forget your own data! Your business’s internal stats can offer a perspective that no one else has.
Just remember to stick a “Sources” list at the bottom of your infographic. It shows you’ve done your homework and builds instant trust.
- Develop a Cohesive Narrative: An infographic isn’t just a collection of random facts and figures – it’s a story. Spend time crafting a cohesive narrative that guides the viewer through the information in a logical and engaging way.
- Design for Maximum Impact: The visual design of your infographic is just as important as its content. Work with a talented designer (like the team at Inkbot Design) to create a visually stunning infographic that is eye-catching and easy to understand.
- Optimise for Search: Remember to optimise your infographic for search engines. Use relevant keywords, write a compelling alt text, and include a detailed caption that provides context for the content.
- Promote, Promote, Promote: Once your infographic is live, it’s time to start promoting it. Share it on your website, social media channels, and industry forums. Reach out to relevant bloggers, publications, and influencers and ask them to share it with their audiences.
Beyond the Blog: The Micro-Infographic Strategy
In 2026, the “long-form” vertical infographic is only one part of the puzzle. With the rise of “snackable” content on LinkedIn and Threads, you must adopt a modular design approach. This is often called the “Atomisation Strategy”.
How to Atomise Your Content
- The Hero Graphic: Your full-scale, deep-dive infographic hosted on your site.
- The Stat-Card: A single, high-impact chart (1:1 ratio) specifically for Instagram or X (Twitter).
- The Carousel: A 5-slide breakdown of your infographic for LinkedIn. Carousels currently see 3x more engagement than static images, leading to more “passive” link building as creators cite your data.
Example Scenario: A cybersecurity firm creates a massive infographic on “The State of Ransomware 2026”. They break it into five separate charts. One chart, showing the “Average Ransom Cost,” goes viral on LinkedIn. A journalist from Wired sees the LinkedIn post, clicks through to the full infographic on the firm’s website, and links to it in a feature article. This is how social-first visuals drive high-authority editorial links.

I know what you’re thinking: “But what if I’m not a designer? How can I create an infographic that looks professional and polished?”
Essential Tools for DIY Infographic Creation
Look, I get it. You might be thinking, “This all sounds brilliant, but I can’t design my way out of a paper bag.”
Fair enough. If you want to have a go yourself before calling in the pros, there are some decent tools out there that make it much less painful.
They won’t replace a skilled designer, but they can get you started.
Canva is the big one, and for good reason. It’s incredibly user-friendly, with thousands of templates.
You just drag and drop elements. It’s a great starting point for beginners.
Then you’ve got Piktochart, as shown in the image above. It’s built specifically for infographics, so its features are really focused on data visualisation.
You can chuck your spreadsheet data in, and it will help you build charts automatically.
Visme is another solid option. It handles infographics well but also does presentations and animations, so it’s quite versatile if you need more than just static images.
And there’s Venngage, which organises its templates by type, like “statistical” or “timeline,” which can save you a lot of time finding a layout that fits your data.
Well, my friends, that’s where Inkbot Design comes in. As a full-service creative agency, we specialise in crafting custom infographics that are visually stunning and optimised for maximum link-building impact.
Our designers, researchers, and content strategists will work with you to develop an infographic that resonates with your target audience and attracts high-quality backlinks from industry-leading publications and influencers.
So, what are you waiting for? Start planning your next link-building infographic today!
Overcoming Common Infographic Challenges
Of course, creating a successful link-building infographic can be more challenging than it sounds. There are a few common challenges that you’ll need to be prepared for:
- Lack of Relevant Data: Sometimes, finding the correct data and statistics to support your infographic’s narrative can be challenging. If this is the case, feel free to get creative. Consider researching, contacting industry experts, or using data visualisation tools to create custom graphics.
- Crowded Marketplace: With infographics becoming increasingly popular, the market is getting increasingly crowded. You’ll need to create something unique and compelling to stand out. Look for unexplored angles or put a fresh spin on a familiar topic.
- Limited Design Capabilities: Only some have the design chops to create a professional-looking infographic. That’s where working with a team like Inkbot Design can be a game-changer. We’ll handle the heavy lifting of design so you can focus on the content and strategy.
- Difficulty with Promotion: Promoting your infographic can be challenging, especially starting from scratch. But don’t worry – you can use plenty of strategies to get the word out. Reach out to industry influencers, leverage your social media channels, and consider paid advertising to amplify your reach.
- Lack of Measurability: Tracking the performance of your infographic can be tricky, but it’s essential for understanding its impact on your link-building efforts. Use tools like Google Analytics, Ahrefs, and Majestic SEO to monitor your backlink growth, referral traffic, and overall engagement.
Well, my friends, that’s where Inkbot Design can step in and save the day.
As a full-service creative agency, we have the expertise, resources, and track record to help you overcome infographic-related obstacles.
The Inkbot Design Advantage: Crafting Infographics That Deliver Results
At Inkbot Design, we’ve been helping businesses of all sizes harness the power of infographics for over a decade. And let me tell you, we’ve seen it all – from the good, the bad, and the downright ugly.
That’s why we’ve developed a comprehensive, end-to-end process for creating infographics that deliver accurate, tangible results. Here’s how it works:
- Consultation: We start by getting to know your business, goals, and target audience. We’ll work with you to identify the most compelling and link-worthy topics for your infographic.
- Research: Our team of researchers will scour the web, crunch the numbers, and uncover the insights and data that will form the foundation of your infographic.
- Design: Next, our talented designers create a visually stunning infographic that is informative and eye-catching. We’ll work closely with you to ensure the final product aligns with your brand and target audience.
- Optimisation: Once the infographic is complete, we’ll optimise it for maximum search engine visibility and social shareability. We’ll ensure it’s appropriately tagged, captioned, and optimised for organic and paid distribution.
- Promotion: Finally, we’ll help you get the word out. We’ll leverage our extensive network of industry influencers, bloggers, and publishers to secure high-quality backlinks and amplify your infographic’s reach.
But don’t just take my word for it – let’s take a look at some of the real-world results we’ve achieved for our clients:
- For a client in the finance industry, we created an infographic on the top economic trends of the year. Within a month, we had secured over 20 high-authority backlinks from industry publications and personal finance blogs.
- For a client in the healthcare industry, we developed an infographic highlighting the latest advancements in medical technology. This infographic was featured on industry-leading websites, generating over 1,000 shares and dozens of backlinks.
- And for a client in the e-commerce space, we created an infographic that showcased the most successful product launch strategies. This infographic was shared by dozens of online retailers and entrepreneurs, significantly increasing referral traffic and backlinks.
The common thread? Inkbot Design’s ability to create infographics that are not only visually stunning but also strategically designed to attract high-quality backlinks and drive tangible results.
Frequently Asked Questions (FAQs)
How do I make my infographic stand out in AI Overviews?
Focus on Entity Density. Ensure your infographic and its surrounding text mention specific, well-known organisations, tools, and experts. Use Schema.org markup to clearly define the data points so AI models can easily parse and cite your “Key Findings” directly in the search results.
Are infographics still effective for SEO in 2026?
Absolutely, but the format has shifted. “Static-only” is out; “Multi-format” is in. The most effective link-building campaigns now use a “Visual Bundle” that includes a high-res infographic, a short TikTok/Reels video summary, and a raw data set for others to cite.
What is the best way to cite sources without cluttering the design?
Use a “Sources” footer with shortened URLs or a QR code in the bottom corner. This keeps the design clean while maintaining the Academic Integrity that high-authority publications like The Guardian or The New York Times require before they will link to you.
How can I track exactly how many links my infographic earned?
Use a combination of Ahrefs (to track new referring domains to that specific URL) and Google Search Console (to see “Link” reports). Additionally, set up a Google Alert for your infographic’s title to catch mentions that may not include a link right away.
Does image file size affect my rankings?
Yes. Large, unoptimised files hurt your Largest Contentful Paint (LCP) score. In 2026, aim for a file size under 500KB by using AVIF compression. If your infographic is exceptionally long, consider breaking it into sections that load as the user scrolls.
Conclusion: Unleash the Power of Infographics for Your Link-Building Success
Well, there you have it, folks – everything you need to know about using infographics to supercharge your link-building efforts. We’ve covered everything from crafting a compelling narrative to promoting your infographic to the right audience.
But let’s be honest – creating a successful, link-worthy infographic is no easy feat. It requires research, design, and strategic promotion that can be overwhelming for even the most seasoned digital marketers.
That’s why I always recommend working with a team of experts like the crew at Inkbot Design. With our end-to-end infographic creation and promotion services, we’ll handle all the heavy lifting so you can focus on what you do best – growing your business.
So, what are you waiting for? Let’s get started on your next link-building infographic today.