
Branded vs Non-Branded Traffic: What the Split Tells You
Branded traffic is a signal of brand demand. Non-branded traffic is your growth lever for discovery and new audience acquisition.
Most firms spend the majority of their SEO budget chasing the second category while ignoring what the first category is telling them – and that confusion is why so many content programmes generate impressive traffic numbers without generating a single recognisable client relationship.
The commercial cost of getting this wrong is not abstract. Firms that cannot distinguish between search activity driven by brand recognition and search activity driven by generic queries have no reliable way to measure whether brand investment is working.
They are flying without instruments at exactly the point when instruments matter most: before a rebrand, before an acquisition, before a growth push into a new market.
Brand equity – the commercial value that accrues when people already want to work with you before you have spoken to them – is directly measurable through branded search trends. Most firms are not measuring it.
This article explains the difference between branded and non-branded traffic, why that difference matters commercially, and why share of search is the metric that connects branded search behaviour to future market share, thereby justifying the investment in brand strategy.
- Branded search signals active brand demand; track share of search as a market share predictor. EDO and Qualtrics report 83% correlation.
- Non-branded traffic fuels discovery but converts less in professional services; track AI Overviews and LLM citations as new visibility metrics.
- Pull 12 months of branded query data from Google Search Console; measure at six and twelve months; growing share of search signals rebrand success.
What Are Branded and Non-Branded Keywords?
Branded keywords are search queries that include your firm’s name, variations of it, or product and service names specific to your organisation. They indicate that a searcher already has a relationship – however slight – with your brand.
Non-branded keywords are queries that do not reference a specific company. They reflect a user’s intent around a topic, problem, or service category without any expressed brand preference.
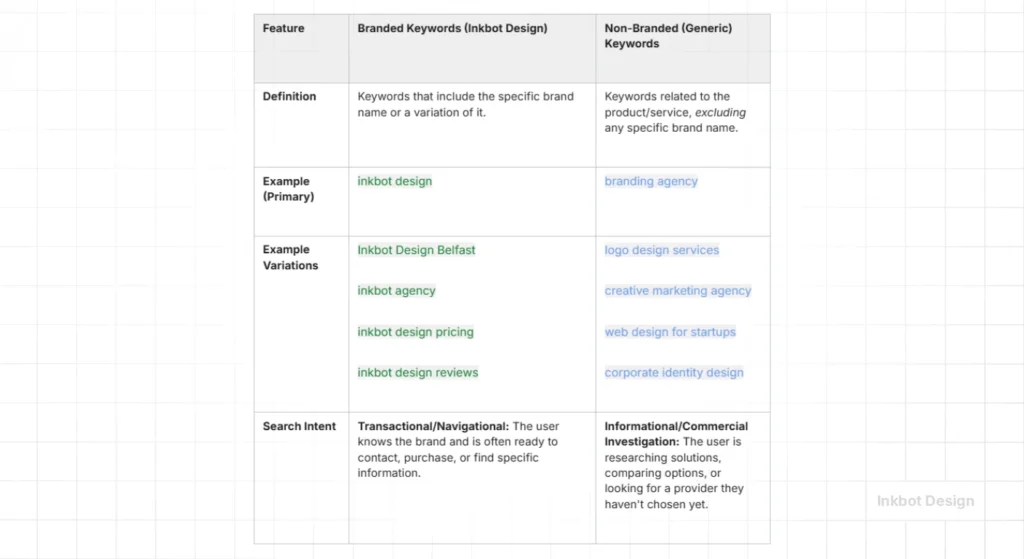
Key distinctions:
- Branded queries signal existing demand – someone is actively looking for you
- Non-branded queries signal category interest – someone is looking for a solution you might provide
- The ratio between the two is a proxy for brand awareness within your market
Branded search traffic measures active brand demand, while non-branded traffic drives discovery; the ratio between them correlates with market share via share of search methodology.
What Your Branded vs Non-Branded Split Is Actually Measuring
The split between branded and non-branded traffic in Google Search Console is not primarily an SEO metric. It is a brand health indicator.
A firm with high non-branded traffic and low branded search volume has succeeded at being visible in search results. It has not necessarily succeeded at being remembered.
Visitors arriving through non-branded queries are often unfamiliar with the firm, have lower intent to engage commercially, and have weaker memory traces after the visit.
That is not a failure – discovery traffic has real value – but treating it as equivalent to branded search volume is a category error that distorts investment decisions.
Branded search volume shows how many people in your market are actively searching for your firm. It answers the question your non-branded traffic cannot: are we building recognition, or are we building category traffic that benefits every firm in our sector equally?
For a professional services firm preparing for a rebrand, this distinction is the difference between knowing your brand has equity worth protecting and assuming it does.
The branded vs non-branded split is not a split between good and bad traffic. It is a split between traffic you created through content and traffic the market created for you through recognition. One measures your SEO investment. The other measures your brand investment. Conflating them produces a strategy that optimises for metrics that do not compound.
Share of Search: The Metric That Connects Branded Traffic to Market Share
Share of search is the number of organic search queries for your brand, expressed as a proportion of all searches in your category. It is the most practically accessible brand measurement tool available to firms without access to large-scale tracking studies.
The commercial case for share of search as a brand metric rests on a specific body of research.
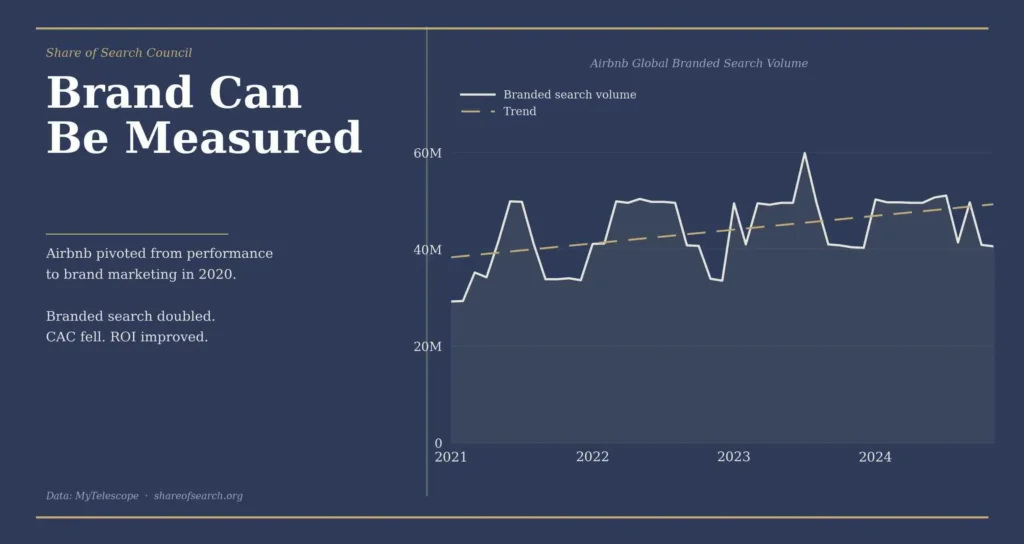
Across 30 case studies in 12 industry categories and seven countries, EDO (Entertainment Data Office) reported an average 83% correlation between share of search and share of market. Qualtrics independently cites the same 83% average correlation between share of search and market share, framing share of search as a useful predictor of business outcomes.
That correlation is not a coincidence. It reflects the reality that branded search queries are a behavioural trace of brand salience – the mental availability that the Ehrenberg-Bass Institute (the marketing science research centre at the University of South Australia) identifies as the primary driver of brand choice in low-involvement purchase situations.
When a professional services firm appears in a decision-maker’s mind at the moment of need, they search for it by name. Share of search measures the aggregate frequency of that behaviour across the market.
For a firm planning a rebrand, the implication is direct: measure your share of search before the rebrand begins. Set a baseline. Measure again at six and twelve months.
The rebrand succeeded if the share of search grew relative to competitors. The rebrand succeeded if the share of search grew relative to competitors. It did not succeed if non-branded content traffic grew while branded query volume stayed flat.
Learn more about how to measure brand awareness using search data before committing to a rebrand programme.
Search share is not a vanity metric for firms that cannot afford brand-tracking studies. EDO’s research across 30 case studies and 12 industry categories shows an average correlation of 83% with market share, for a professional services firm, that makes branded search volume one of the most commercially significant numbers in their entire analytics stack – and one of the least frequently reviewed.
Why Non-Branded Traffic Has Lower Commercial Value in a Professional Services Context
Non-branded traffic is not valueless. For an early-stage firm with no brand recognition, non-branded content is the primary way to generate awareness. For an established firm, non-branded traffic maintains category visibility and feeds the top of the funnel.
But in professional services, the purchase decision is high-value, high-trust, and often preceded by months of passive awareness before any active search. A managing partner at a 150-person law firm does not instruct an appointment letter to a rebranding agency because they clicked on a non-branded article about “how to choose a branding agency.”
They do so because the agency name appeared in their consciousness at the right moment – through word of mouth, through a partner recommendation, through repeated low-grade awareness built over time.
Qualtrics notes that branded search traffic typically delivers conversion rates that are significantly higher than those for non-branded traffic.
That gap is more pronounced in professional services than in most other sectors, because the buyer journey is longer and trust accumulation is slower. Non-branded visitors are prospects. Branded search visitors are often pre-qualified leads expressing active intent.
The implication for budget allocation is uncomfortable for firms that have built entire content programmes around non-branded rankings. If branded search volume is not growing alongside non-branded content investment, the content programme is building category education without building brand recall.
That is a generous way of saying the firm is paying for someone else’s market.
Also see: share of search – a detailed breakdown of how to calculate and track this metric inside Google Search Console.
In professional services, the conversion gap between branded and non-branded traffic is not solely a function of keyword intent. It is a function of trust. A branded query visitor has already decided the firm is worth investigating. A non-branded query visitor has not. Treating both as equivalent in pipeline forecasting is the same analytical error as treating a warm referral and a cold enquiry form as identical revenue signals.
The Myth That More Non-Branded Traffic Always Means Better SEO Performance

For most of SEO’s history, growing non-branded organic traffic was an unambiguous positive signal. Higher non-branded volume meant better content, broader keyword coverage, and greater reach into new audiences.
The advice to “prioritise non-branded traffic growth” was a sound strategy for a search environment where most informational queries returned a ranked list of ten blue links.
That environment is changing in structural, not cyclical, ways. By 2026, AI Overviews, zero-click SERP features, and LLM-based answer engines are absorbing click volume from exactly the informational non-branded queries where most content programmes compete.
A 2026 CTR benchmark report found that the top three organic Google results receive 68.7% of all clicks, and the number-one organic result receives, on average, 19 times more clicks than the top paid search result.
The remaining click volume is increasingly concentrated at the very top of results, and AI-generated answers are appearing above even those positions for informational queries.
Branded queries are less susceptible to this cannibalisation. A user searching for your firm’s name is not looking for an AI summary of the topic. They are looking for you specifically. That navigational and recognition-driven behaviour produces clicks regardless of what appears above the organic results.
The replacement directive is specific: stop using non-branded traffic growth as the primary measure of SEO performance. Add share of search as a parallel metric.
If non-branded traffic is flat or declining because AI Overviews are absorbing informational impressions, but the share of search is growing, your SEO investment is working. The clicks are just going somewhere else before they become a session.
Branded vs Non-Branded Traffic in 2026: What Has Changed and What Hasn’t
The definition of branded and non-branded keywords has not changed. The environment in which they operate has.
Several 2026 industry trend reports confirm that organic search clicks are declining in real terms as AI Overviews, zero-click features, and LLM-generated answers reduce click volume from informational queries.
Marketers are responding: 61% of marketers report increasing SEO budgets in 2026, with owned content – blogs, websites, knowledge hubs – identified as a top ROI channel. That investment shift reflects an understanding that the asset being built is not just a traffic engine but a citation source for AI systems.
This matters for the branded vs non-branded question in a specific way. When Perplexity, SearchGPT, or Google AI Mode answers a query about “brand strategy for professional services firms,” the content they cite becomes the de facto brand signal for the agencies mentioned within it.
Non-branded content that generates AI citations produces brand awareness through a mechanism that does not register as a click in Google Search Console. Branded search growth that follows AI citation exposure confirms the awareness loop is working – even without a direct traffic referral.
Analysts now advise adding a second measurement surface alongside traditional organic metrics: LLM citation tracking. The logic is that LLM citations can replace clicks as a pathway to brand awareness and consideration. Branded search volume, visible in Google Search Console, serves as a downstream indicator that LLM citations and brand content are doing their job.
Google held approximately 90.02% global search market share as of April 2026. For most firms, a branded search strategy is still executed and measured primarily within Google’s search ecosystem.
The share of search methodology remains a live, citable metric in 2026, with EDO and Qualtrics research still actively cited as showing an 83% correlation between share of search and market share.
For professional services firms, the practical upshot is this: non-branded content investment in 2026 should be evaluated against two metrics, not one. Traditional organic traffic in Search Console measures what it always measured.
AI citation frequency – trackable through prompt-based monitoring of tools like Perplexity and ChatGPT – measures the new surface. If non-branded content is generating neither clicks nor AI citations, the investment case does not hold.
How to Set a Pre-Rebrand Branded Search Baseline
A rebrand without a branded search baseline is an investment without a measurement framework. This is the most common analytical gap we see in pre-rebrand planning conversations with professional services firms.
The baseline process is not complex. In Google Search Console, filter Performance data to exclude all branded queries – any query containing the firm name, common misspellings, or sub-brand names. Record the monthly impression and click volume for branded terms across a twelve-month trailing period. Note the trend direction: is branded search volume growing, stable, or in decline?
That trend is the brand equity indicator. A firm with declining branded search over the past 12 months is experiencing brand erosion regardless of what its non-branded traffic is doing. A firm with growing branded search in a stable category is building the kind of brand salience that precedes market share growth.
Conduct the same exercise for two or three direct competitors using the share of search methodology – the proportion of category-wide branded searches that resolve to your firm versus theirs. If your share of search has declined while a competitor’s has grown, the rebrand is not optional. It is overdue.
Post-rebrand, repeat the measurement at 6 and 12 months. The rebrand is working if branded search volume has grown relative to the pre-rebrand baseline and relative to competitors. Non-branded traffic growth tells you the content team is active. Branded search growth tells you the brand is working.
The pre-rebrand search baseline is the metric that most professional services firms are not collecting before committing to a brand investment. Without it, there is no objective way to evaluate whether the rebrand produced a return. Setting that baseline costs nothing. Not setting it means the firm will never know whether the investment worked – and will not be able to justify the next one.
Branded vs Non-Branded: The Decision Framework
| Decision Point | The Wrong Way | The Right Way | Why It Matters |
| Measuring SEO performance | Total organic traffic growth | Branded search volume trend + non-branded traffic | Non-branded growth without branded growth signals awareness without recall |
| Evaluating a rebrand’s success | Website sessions and bounce rate | Share of search before and after | Share of search captures market perception; sessions capture activity |
| Allocating SEO budget | All budget to non-branded content | Baseline branded search, then allocate discovery spend | Branded queries convert at higher rates; underinvestment here is a revenue leak |
| Benchmarking against competitors | Checking competitor domain authority | Calculating the share of search across the category | Share of search has an 83% average correlation with market share per EDO research |
| Responding to a branded search drop | Ignoring it as an algorithm fluctuation | Investigating as a brand health signal | A sustained branded search decline precedes pipeline decline by 3–6 months |
| Reporting to leadership | Total traffic numbers | Branded vs non-branded ratio over time | The ratio tells leadership whether brand investment is generating recognition |
| Setting a rebrand success metric | “We want more website visitors” | “We want the share of search to grow by X% in 12 months” | Specific, measurable, tied to commercial outcomes |
The Verdict
The split between branded and non-branded traffic is not a technical SEO segmentation exercise. It is a commercial diagnostic.
Firms that read it correctly have a leading indicator of brand equity that is visible inside the free tools they already have access to. Firms that ignore it – or flatten both categories into a single “organic traffic” figure – are managing brand investment without a measuring instrument.
The argument that runs through this article resolves to a specific sequence: non-branded traffic serves as your discovery mechanism. Branded search volume is your brand demand signal. The ratio between them is your brand health indicator.
And share of search – your branded query volume as a proportion of category-wide search – is the metric that connects the entire picture to market share with a documented 83% average correlation.
In 2026, as AI Overviews absorb informational non-branded clicks, the commercial value of non-branded traffic as a standalone metric is declining. The firms that will be positioned well in three to five years are the ones building content that generates both clicks and AI citations – and tracking whether that content investment is converting into growing branded search demand.
The single most important action a professional services firm can take this week: pull 12 months of branded query data from Google Search Console and identify the trend. If the line is flat or declining while content investment is growing, something is wrong. That something has a name, and it is fixable.
If you want a structured diagnostic that identifies exactly where your brand is losing commercial ground – and what to do about it – request a free Brand Equity Audit™.
Frequently Asked Questions
What is the difference between branded and non-branded traffic in SEO?
Branded traffic comes from search queries that include your firm’s name or specific product names, indicating existing brand awareness. Non-branded traffic comes from generic topic or category queries with no named firm preference. Both types serve different stages of the buyer journey and require different measurement frameworks to evaluate their commercial contribution.
Why does branded search volume matter more than total organic traffic?
Branded search volume measures how many people in your market are generating specific demand for your firm – a direct indicator of brand salience. Total organic traffic conflates branded and non-branded signals, making it an unreliable measure of brand investment performance. A firm with growing non-branded traffic and flat branded search is building category awareness, not brand equity.
What is the share of search, and how does it relate to branded traffic?
Share of search measures your firm’s branded query volume as a proportion of all branded searches in your category. EDO research across 30 case studies in 12 industry categories reported an average correlation of 83% between share of search and market share, making it one of the most commercially grounded brand measurement tools available without commissioning a formal tracking study.
How should a professional services firm calculate its share of search?
Use Google Search Console to extract branded query volume for your firm and your two or three closest competitors over a consistent period – typically twelve months. Divide your branded query volume by the combined total to produce a percentage share. Track this monthly. Movement in that share is a leading indicator of a brand’s competitive positioning.
Does non-branded SEO investment build brand awareness?
Non-branded content builds category visibility, which can contribute to brand awareness when it aligns with a memorable brand identity and a consistent visual presence. Non-branded content alone, distributed across generic informational queries, builds category education rather than brand recall. Awareness of a topic is not the same as awareness of a firm.
Why is my branded search volume declining while website traffic is growing?
Traffic growth driven entirely by non-branded content means discovery activity is increasing while brand recognition is not growing in parallel. Causes include: content associated with a topic rather than a brand, inconsistent brand identity across content, or a rebrand that changed brand-name recognition cues. Investigate branded query trends over 12–24 months to determine whether the decline preceded or followed the content push.
When should a professional services firm prioritise branded vs non-branded keyword strategy?
Established firms with existing market presence should actively monitor and protect branded search volume while using non-branded content for discovery. Early-stage firms should prioritise non-branded discovery content until sufficient name recognition exists to generate measurable branded queries. Firms preparing for a rebrand should baseline both categories before the rebrand and measure both for twelve months following launch.
How do AI Overviews affect the branded vs non-branded traffic balance?
AI Overviews and zero-click SERP features primarily absorb informational non-branded query clicks, reducing the click volume available to non-branded content. Branded queries are less affected because they reflect navigational and recognition-driven intent. In 2026, this structural shift makes branded search volume increasingly significant as a proportion of total actionable organic traffic.
What conversion rate difference exists between branded and non-branded traffic?
Branded search traffic typically produces higher conversion rates than non-branded traffic. Qualtrics notes that branded search visitors convert at substantially higher rates, reflecting the fact that a branded query visitor has already formed a positive awareness of the firm before arriving at the site. In professional services, where trust is the primary purchase driver, this gap is more pronounced than in product-led categories.
How should a rebrand’s success be measured using search data?
Establish a branded search baseline – monthly branded query volume and share of search – before the rebrand launches. Measure again at six months and twelve months. A successful rebrand should produce growing branded search volume relative to the pre-launch baseline and growing share of search relative to competitors. Flat or declining branded search after a rebrand is a warning signal that the new brand identity has not generated recognition transfer from the previous identity.
Is it possible to have too much branded traffic relative to non-branded?
A very high branded-to-non-branded ratio can indicate limited reach beyond an existing client base – the firm is not generating discovery activity among potential new clients. For a growth-stage firm or one entering a new market segment, this signals a need to invest in non-branded discovery content. The target ratio is context-dependent, but a healthy growing firm should show increasing absolute values in both categories over time.
What tools can measure the branded vs non-branded traffic split?
Google Search Console is the primary free tool – filter Performance data by queries containing the firm name versus all other queries. Google Analytics 4 can segment organic traffic using regular expression (regex) filters for branded terms. SEO platforms, including SEMrush and Ahrefs, allow branded keyword filtering within organic traffic reporting. For the share-of-search calculation, manual extraction and ratio calculation from Google Search Console data is the most reliable approach for most professional services firms.
