
What Is Net Promoter Score (NPS) and Why It Matters
Customer loyalty. Every business chases the golden ticket, yet many struggle to measure it effectively. How do you quantify something as seemingly abstract as loyalty? And once you've measured it, what do you do with that information?
Enter the Net Promoter Score (NPS) – arguably the most straightforward yet powerful metric for gauging customer sentiment. But don't be fooled by its simplicity. Behind that single number lies a wealth of insights that can transform your business strategy, boost retention, and fuel sustainable growth.
- NPS measures customer loyalty through a simple question, categorising respondents as Promoters, Passives, or Detractors.
- Effective NPS programmes boost customer retention rates significantly and drive sizeable profit increases.
- Both relational and transactional NPS approaches provide valuable insights into customer relationships over time.
- Qualitative feedback from NPS is crucial for understanding customer sentiments and driving meaningful changes.
- Closing the feedback loop with customers improves NPS scores and drives long-term sustainable growth.
The Fundamentals of Net Promoter Score
Net Promoter Score isn't just another business metric. It's a management philosophy that puts customer loyalty at the heart of your business decisions.
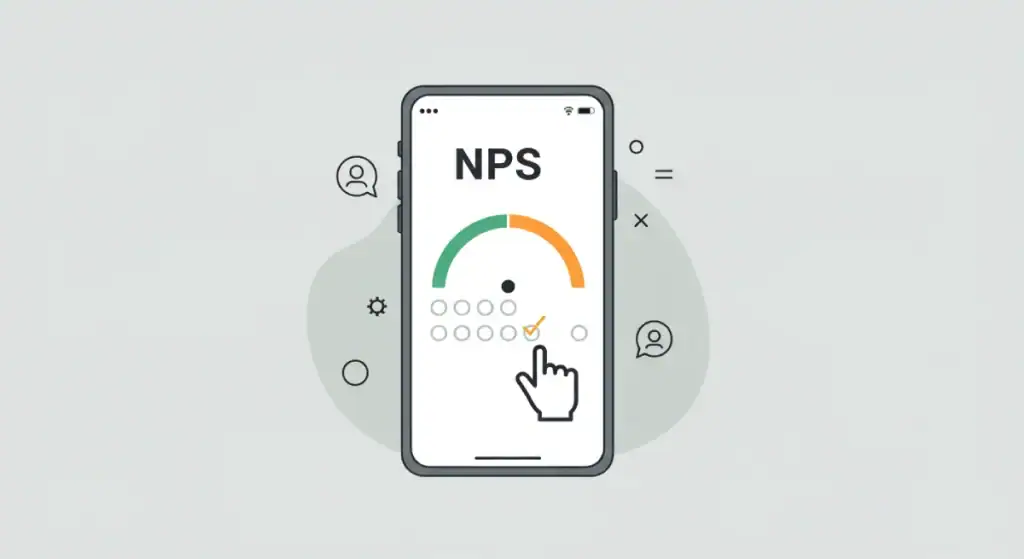
Developed by Fred Reichheld and Bain & Company in 2003, NPS distils the complex customer experience into a single, actionable number. It's based on a straightforward question: “On a scale of 0-10, how likely are you to recommend our company/product/service to a friend or colleague?”
Respondents fall into three categories:
- Promoters (9-10) – Your enthusiastic advocates who fuel growth through positive word-of-mouth
- Passives (7-8) – Satisfied but unenthusiastic customers are vulnerable to competitive offerings
- Detractors (0-6) – Unhappy customers who can damage your brand through negative word-of-mouth
The NPS calculation itself couldn't be simpler:
NPS = % of Promoters – % of Detractors
The final score ranges from -100 (all detractors) to +100 (all promoters). While the calculation is easy, the insights it provides are profound.
Beyond the Basic Formula
NPS isn't just about the number—it's about what you do with it. The best companies use NPS as part of the broader Net Promoter System, which closes the feedback loop and drives meaningful change.
Think of it this way: if your doctor only took your temperature but never prescribed treatment, would that help you get better? Of course not. The same applies to NPS. The score is just a diagnosis—the prescription comes from your follow-up actions.
Recent research shows that companies implementing NPS programmes effectively see customer retention rates that are 2.4 times higher than their competitors. The economic impact is clear—a 5% increase in customer retention can boost profits by 25-95%.
Relational vs Transactional NPS: Understanding the Difference

When implementing NPS, you must decide what type of feedback you're after. There are two primary approaches:
Relational NPS
This measures the overall customer relationship with your brand. Typically sent out quarterly or annually, relational NPS surveys help you track loyalty over time and benchmark against competitors.
Relational NPS gives you a big picture, like an annual health check-up, measuring your overall fitness.
Transactional NPS
Transactional NPS captures feedback immediately after specific interactions (purchase, support call, etc.). At the same time, the experience is fresh in the customer's mind.
Transactional NPS is like checking your heart rate during and after exercise—it tells you how you perform in specific situations.
Both approaches have their place. Most successful companies use a combination, with relational NPS providing strategic direction and transactional NPS offering tactical insights.
The Science Behind Net Promoter Score
What makes NPS such a reliable predictor of business growth? The answer lies in human psychology and economics.
When someone recommends your business, they're putting their reputation on the line. That's not something people do lightly. This personal risk makes the recommendation question a powerful predictor of customer behaviour.
Research shows that promoters are:
- 5 times more likely to repurchase
- 7 times more likely to try new offerings
- 4 times more likely to forgive a company after a bad experience
Meanwhile, detractors account for 80% of negative word-of-mouth and have a churn rate 2.7 times higher than that of promoters. The math isn't complicated—more promoters and fewer detractors lead to sustainable growth.
But here's where many companies go wrong—they focus solely on moving the needle rather than understanding what's behind the number. This brings us to the most crucial aspect of NPS: the follow-up.
NPS Calculation: Getting the Numbers Right
Let's break down the NPS calculation with a practical example:
Imagine you've surveyed 100 customers and received the following responses:
- 55 gave scores of 9-10 (Promoters)
- 30 gave scores of 7-8 (Passives)
- 15 gave scores of 0-6 (Detractors)
Your NPS would be: 55% – 15% = 40
That means your NPS is +40, which is generally considered reasonable in most industries. But remember, the absolute number matters less than:
- Your trend over time
- How do you compare to industry benchmarks
- What do you do with the feedback
The calculation itself is straightforward, but ensuring valid results requires careful attention to:
- Sample size – You need enough responses for statistical significance
- Response rates – Typically, 15-30% is considered acceptable
- Timing – When you ask, it impacts what answers you get
- Segmentation – Different customer groups may have vastly different experiences
NPS Benchmarks: How Do You Measure Up?
A score of +40 sounds good, but is it? That depends entirely on your industry.
In specific sectors like luxury hospitality, scores above +70 are achievable. In contrast, cable companies and airlines consider +20 a solid performance—context matters.
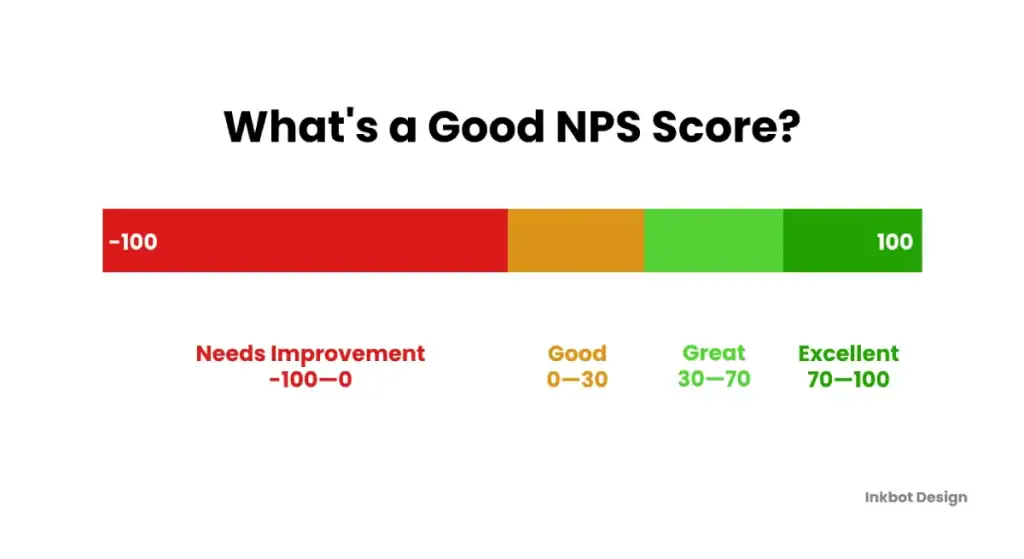
Here's a rough guide to interpreting your NPS:
- Above +50: Excellent
- +30 to +50: Good
- +0 to +30: Needs improvement
- Below 0: Requires immediate attention
Industry averages vary widely:
- Technology: +31
- Retail: +27
- Financial Services: +34
- Healthcare: +38
- Telecommunications: +12
But don't just benchmark against your industry—benchmark against the best. Companies like Apple (+68), Tesla (+64), and Costco (+62) set the gold standard for customer loyalty across sectors.
The most valuable comparison, however, is with yourself over time. Tracking your NPS trend provides insight into whether your customer experience initiatives work.
Beyond the Score: The Voice of the Customer
The actual value of NPS lies not in the number but in the qualitative feedback accompanying it. The follow-up question is crucial: “What is the primary reason for your score?”
This open-ended question provides the context you need to take meaningful action. It captures the Voice of the Customer (VoC) in their own words—unfiltered insights that quantitative metrics alone can't provide.
Analysing this feedback reveals patterns and themes that drive your scores. For instance, you might discover that:
- Promoters consistently mention your responsive customer service
- Passives appreciate your product but find your pricing confusing
- Detractors are frustrated by long wait times
According to an analysis of customer experience, companies that systematically analyse VoC feedback show 10x greater year-over-year revenue growth than competitors.
Implementing an Effective NPS Programme

Setting up an NPS programme isn't complicated but requires careful planning. Here's a step-by-step approach:
1. Define Your Objectives
Start by clarifying what you want to achieve. Are you looking to:
- Reduce churn
- Increase cross-selling
- Improve specific touchpoints
- Benchmark against competitors
Your objectives will shape your entire approach.
2. Design Your Survey
Please keep it simple. Beyond the standard NPS question, add no more than 2-3 follow-up questions. Remember, response rates drop significantly with every additional question.
Practical follow-up questions include:
- “What is the primary reason for your score?”
- “What could we do to improve your experience?”
- “What is the one thing we should never stop doing?”
3. Choose Your Timing and Frequency
For relational NPS, quarterly or bi-annual surveys work well. For transactional NPS, timing is critical—send surveys when the experience is fresh but not so immediately that the customer hasn't had time to form an opinion.
4. Select Your Distribution Channels
Email remains the most common channel, but in-app, SMS, and post-call surveys can yield higher response rates for specific interactions.
5. Analyse and Act on Results
This is where most programmes fall short. Establish a systematic approach to:
- Categorise feedback into actionable themes
- Prioritise issues based on impact and feasibility
- Assign ownership for follow-up actions
- Close the loop with respondents
Remember, an NPS programme without action is an expensive way to annoy your customers.
Closing the Feedback Loop: The Key to NPS Success

The most critical element of any NPS programme is the “close the loop” process—responding to feedback in a way that shows customers you're listening.
This process works at three levels:
1. Individual Level
Reach out to detractors within 24-48 hours. According to customer recovery studies, this rapid response can turn 60% of detractors into promoters. Acknowledging their concerns makes a significant difference, even if you can't solve them immediately.
2. Operational Level
Address systemic issues that affect customer segments. If multiple customers mention the same pain point, it warrants immediate attention.
3. Strategic Level
Use aggregate insights to inform product development, service improvements, and broader business strategy. This connects NPS directly to your innovation pipeline.
Companies that excel at closing the loop see NPS improvements of 15-20 points within 12 months, translating to measurable revenue growth.
NPS vs Other Customer Metrics: When to Use What
NPS isn't the only customer metric out there. Understanding how it compares to other measures helps you build a comprehensive measurement framework.
Customer Satisfaction Score (CSAT)
CSAT measures satisfaction with a specific interaction or product. While NPS focuses on overall loyalty, CSAT provides granular feedback on particular experiences.
Use CSAT when you need immediate feedback on specific touchpoints or features.
Customer Effort Score (CES)
CES measures how easily customers can get their issues resolved or tasks completed. It's based on the principle that reducing customer effort builds loyalty.
Use CES when evaluating service interactions, particularly in support scenarios.
Customer Retention Rate
This tracks the percentage of customers who remain with you over a specific period. At the same time, NPS predicts future retention, and the retention rate measures actual behaviour.
The ideal approach combines these metrics to provide a 360-degree view of your customer experience.
Common NPS Pitfalls and How to Avoid Them
Even well-intentioned NPS programmes can go off track. Here are the most common mistakes and how to avoid them:
1. Survey Fatigue
Bombarding customers with surveys leads to lower response rates and less reliable data.
Solution: Coordinate survey timing across your organisation and limit frequency to preserve the quality of responses.
2. Focusing Only on the Score
Obsessing over the number while ignoring the “why” behind it renders your programme nearly useless.
Solution: Allocate 80% of your analysis time to qualitative feedback and only 20% to the score.
3. Failure to Act
Collecting feedback without taking action erodes customer trust and wastes resources.
Solution: Implement a formal process for reviewing feedback and tracking improvements based on customer input.
4. Sampling Bias
Surveying only specific customer segments gives you a skewed picture of overall loyalty.
Solution: Ensure your sample represents your customer base, including different segments, tenures, and usage patterns.
5. Gaming the System
When NPS becomes tied to compensation, the risk of manipulation increases.
Solution: Use multiple metrics for performance evaluation and audit your NPS process regularly.
Real-Time NPS Monitoring: The Future of Customer Feedback
Traditional NPS programmes operated on quarterly or annual cycles. Today's leading companies are moving toward continuous, real-time monitoring that enables immediate intervention.
Real-time NPS platforms offer several advantages:
- Instant alerts when detractors require follow-up
- Dynamic dashboards that show trends as they emerge
- Integration with CRM systems for contextual understanding
- Automated workflows that trigger specific actions based on feedback
This shift from periodic measurement to continuous monitoring transforms NPS from a lagging indicator to a leading indicator of customer behaviour.
Companies using real-time NPS monitoring respond to issues 73% faster and see 31% higher conversion rates on recovery efforts.
NPS Best Practices for Different Business Types
The optimal NPS strategy varies based on your business model:
For B2C Companies
- Focus on emotional connections in follow-up questions
- Use transactional NPS frequently at key journey points
- Segment analysis by customer value and tenure
- Prioritise mobile-friendly survey formats
For B2B Companies
- Include multiple stakeholders from each client
- Focus on relationship-level metrics with quarterly measurements
- Integrate NPS with account planning and management
- Connect feedback directly to customer success teams
For Subscription Businesses
- Measure NPS at specific lifecycle milestones
- Correlate scores with renewal likelihood
- Focus intensely on the early experience of NPS
- Monitor score drops as early churn indicators
For Ecommerce
- Balance post-purchase and relationship surveys
- Focus on the delivery experience as a key driver
- Segment by product categories and price points
- Connect NPS with returns and repeat purchase data
NPS Implementation Strategy: A 90-Day Plan
Ready to launch or revamp your NPS programme? Here's a practical 90-day implementation plan:
Days 1-30: Foundation
- Set clear objectives and KPIs
- Select appropriate NPS software
- Design your survey flow
- Establish baseline metrics
- Train your team on NPS principles
Days 31-60: Launch
- Begin with a small pilot group
- Refine the survey based on initial feedback
- Develop a categorisation system for comments
- Create closed-loop response protocols
- Build reporting dashboards
Days 61-90: Optimisation
- Scale to the whole customer base
- Integrate NPS data with other business systems
- Establish a regular review cadence
- Begin tracking improvements over time
- Communicate wins to the broader organisation
This phased approach ensures you build a sustainable programme rather than a one-off measurement exercise.
NPS Software: Choosing the Right Tools
The right technology can make or break your NPS programme. Key features to look for include:
- Multi-channel distribution – Email, SMS, in-app, web
- Text analytics – Automated categorisation of open-text responses
- Integration capabilities – Connects with your CRM, support desk, etc.
- Closed-loop functionality – Manages follow-up workflow
- Customisable dashboards – Tailored to different stakeholders
- Alert systems – Notifies relevant teams about detractor feedback
Popular NPS platforms include Qualtrics, Delighted, AskNicely, and CustomerGauge, but the right choice depends on your specific requirements and existing tech stack.
The ROI of NPS: Making the Business Case
Investing in an NPS programme requires resources. How do you justify the expenditure? By connecting NPS improvements directly to financial outcomes.
Research consistently shows that:
- A 7-point improvement in NPS correlates with 1% revenue growth
- Promoters have a 2.4x higher lifetime value than passives
- Detractor recovery delivers an average 20x ROI on the cost of intervention
To calculate your specific ROI:
- Determine the revenue impact of converting passives to promoters
- Calculate the cost savings from reducing detractors
- Factor in operational efficiencies from process improvements
- Subtract programme costs (technology, resources, etc.)
Most companies find that even a modest improvement in NPS delivers substantial returns, often exceeding 100% ROI within the first year.
Frequently Asked Questions About Net Promoter Score
What's a good NPS score for my industry?
While benchmarks vary by sector, focusing on your trend and the qualitative feedback behind your score is more important than the absolute number. That said, scores above +50 are generally considered excellent across industries.
How often should we measure NPS?
For relational NPS, quarterly or bi-annual measurement provides a good balance. Specific customer interactions should trigger transactional NPS. Avoid survey fatigue by coordinating across your organisation.
Can NPS predict customer churn?
Yes, NPS is a strong leading indicator of churn. Detractors are 2.7 times more likely to leave within 90 days than promoters. Monitoring NPS trends by segment can help you identify at-risk customers before they leave.
How many responses do we need for valid results?
For statistical significance, aim for at least 100 responses per segment you want to analyse. Response rates typically range from 15-30%, depending on your industry and relationship strength.
Should we offer incentives for completing NPS surveys?
Generally no. Incentives can bias your results and attract respondents motivated by rewards rather than a genuine desire to provide feedback. Focus instead on explaining how feedback will be used to improve their experience.
How do we calculate NPS for multiple products or services?
You can calculate a separate NPS for each offering and maintain an overall relationship NPS. This helps you identify which products or services enhance or detract from your customer relationship.
What's the difference between NPS and customer satisfaction?
NPS measures loyalty and likelihood to recommend, while satisfaction measures happiness with specific interactions. NPS predicts future behaviour and business growth more, while satisfaction helps diagnose specific experience issues.
Can we use NPS for employees (eNPS)?
The same methodology can measure employee loyalty with the question: “How likely are you to recommend working here to a friend or colleague?” Employee NPS strongly correlates with customer NPS and can identify internal issues affecting customer experience.
How do we handle cultural differences in NPS scoring?
Cultural factors can influence how people use rating scales. In some regions, respondents rarely give 10s; in others, they avoid low scores. Account for this by benchmarking within areas rather than directly comparing across cultures.
What should we do if our NPS is negative?
A negative score indicates you have more detractors than promoters—a dangerous position. Focus immediately on: 1) Understanding detractor feedback, 2) Addressing the most common issues, and 3) Implementing a systematic closed-loop process to recover detractors.
The Future of Net Promoter Score
As customer experience continues to evolve, so too does NPS methodology. Watch for these emerging trends:
Predictive NPS
Advanced analytics can now predict NPS scores based on behavioural data, identifying at-risk customers before they become detractors.
Voice and Emotion Analysis
AI-powered tools can analyse voice tone in call centre interactions to gauge sentiment and predict NPS without formal surveys.
Integrated Experience Measurement
The next frontier combines NPS with operational metrics, digital behaviour tracking, and support interactions for a holistic view of the customer journey.
Real-Time Service Recovery
Automated systems that trigger immediate intervention when negative feedback arrives, often resolving issues before the customer has even completed the survey.
Turning Feedback into Growth
Net Promoter Score has endured for nearly two decades because it works. Behind its simplicity lies a powerful truth: customers who love you tell others, and word-of-mouth drives sustainable growth.
But remember—the score is just the starting point. The magic happens when you act on the feedback, close the loop with customers, and make loyalty a central part of your business strategy.
Your NPS journey starts with a simple question. What you do with the answers determines whether you'll merely have a number or a genuine competitive advantage.
Ready to promote your promoters?
Request a quote to see how we can help strengthen your brand through customer-centric design that drives loyalty and boosts your Net Promoter Score.


