The Perceptual Map: How to Visualise & Fill Market Gaps
If you can’t plot exactly where you sit in the mind of your customer compared to your rivals, you aren’t “positioning”—you’re just making noise.
A perceptual map is the only way to see the market as it actually exists, not as you wish it to be.
Ignoring this tool is why 90% of “unique” startups look identical to their competitors within eighteen months. They find a “gap” that is actually a graveyard.
This guide focuses on identifying gaps that represent potential profit.
- Perceptual maps reveal how customers actually see brands, using discriminant attributes to identify real market positions.
- Use rare, multidimensional attributes not simple price versus quality to uncover genuine, profitable gaps.
- Build maps from real-time data and robust methods (MDS, Correspondence Analysis, NLP) rather than biased surveys.
- Validate gaps against demand and Ideal Points; empty space can be a death zone, not a blue ocean.
What is a Perceptual Map?
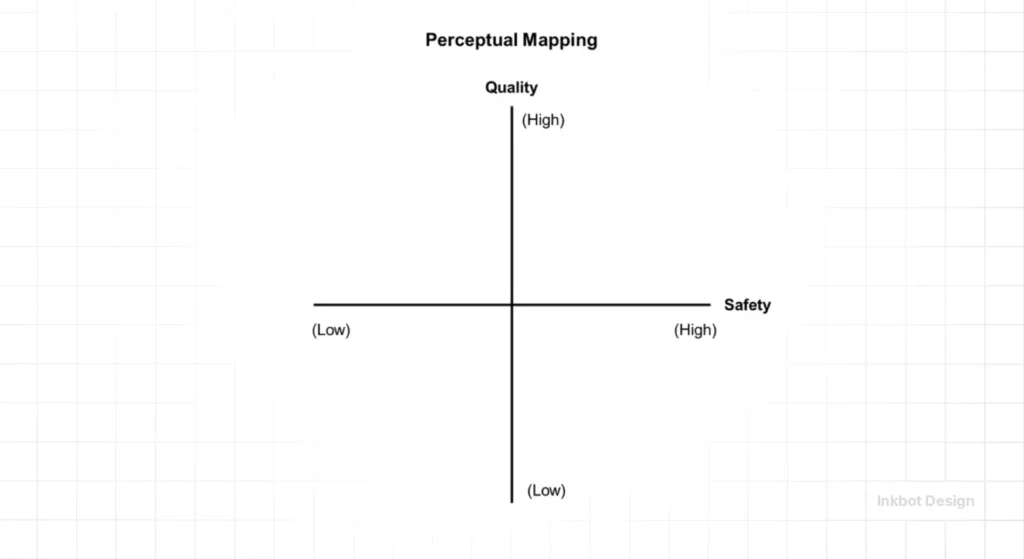
A perceptual map is a visual representation of how target customers perceive specific brands, products, or services in relation to their competitors.
It uses a Cartesian coordinate system (X and Y axes) to plot brands based on “Discriminant Attributes”—the features that drive consumer choice and brand differentiation.
Core Elements:
- The Axes: Two or more dimensions representing specific brand attributes (e.g., Innovation vs Tradition).
- The Data Points: Competitor brands plotted based on aggregated consumer survey data or market research.
- The Gaps: Unoccupied clusters on the map that indicate potential market opportunities or “Phantom Gaps.”
Why Traditional Mapping is Breaking
For decades, marketers used static surveys to build these maps. In 2026, that’s a recipe for obsolescence. Consumer sentiment moves at the speed of a trending thread.
If your map is based on a survey from six months ago, you are navigating with a map of a city that has since undergone redesign.
Success now requires a focus on branding and positioning that accounts for “LLM Visibility”—how AI models perceive and categorise your brand.
If ChatGPT or Claude can’t distinguish your brand from the market leader in their internal high-dimensional vector space, you effectively don’t have a brand.
Phase 1: Identifying the Right Dimensions (The “Axes” Trap)
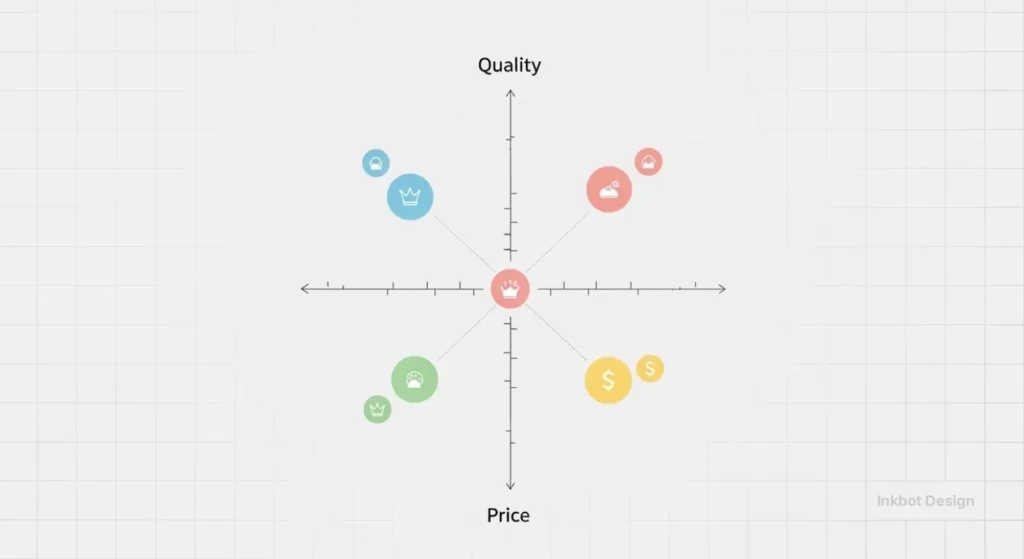
The biggest mistake I see in my consultancy work is the “Price/Quality” trap. It’s lazy. Every brand claims high quality and “fair” pricing.
If you use these as your axes, you’ll end up with a diagonal line where everyone is bunched in the middle.
To find real gaps, you must look for Rare Attributes. These are the technical or psychological nuances that your competitors ignore.
Root vs. Rare Attributes in Mapping
| Feature | The Amateur Way (Root) | The Professional Way (Rare/Unique) |
| Axis Selection | Price vs. Quality | Technical Performance vs. Emotional Resonance |
| Data Source | Internal “Hunch” | Multidimensional Scaling (MDS) of Real Data |
| Competitor Set | Direct Rivals Only | Direct, Indirect, and Category Disrupters |
| Gap Interpretation | “Empty space = Opportunity” | “Empty space = Potential Death Zone (Verify First)” |
| Frequency | Once a year | Real-time via Sentiment API |
Real-World Example: The “Value” Shift
Look at the UK supermarket sector. For years, the map was built on the principles of “Variety” and “Service.” Waitrose owned High Variety/High Service; Tesco sat in the middle.
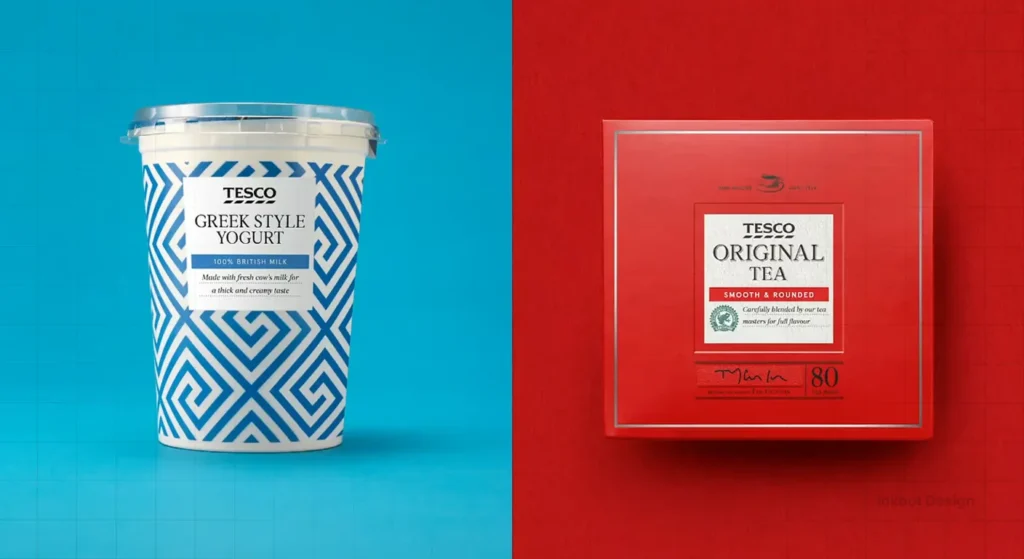
Then Aldi and Lidl entered.
They didn’t just compete on price—they mapped an entirely new axis: “Efficiency of Choice.” They proved that a segment of consumers actually preferred having only two types of ketchup if it meant they could get in and out in ten minutes.
They filled a gap that the “Big Four” didn’t even realise existed.
Phase 2: Gathering Data (Beyond the Hunch)
If you fill out a perceptual map based on what you think people think of you, you are just drawing a map of your own ego. You need external data.
In 2026, we will use Correspondence Analysis (CA). This is a statistical technique that takes a table of “Brand vs. Attribute” and turns it into a map. It removes the researcher’s bias.
You might find that while you think your brand is “Innovative,” the market actually perceives you as “Complex.”
“According to McKinsey & Company, brands that use data-driven positioning to personalise their value proposition see a 40% increase in revenue compared to those using generic strategies.”
Automated Data Extraction & Python Implementation
In 2026, manual surveys are often supplemented by Natural Language Processing (NLP).
To build a map that reflects real-time sentiment, professionals use Python to scrape brand mentions and run Multidimensional Scaling (MDS).
Python

# Simplified 2026 MDS Mapping logic

from sklearn.manifold import MDS

import matplotlib.pyplot as plt

# Distance matrix representing brand dissimilarity

data = [[0, 5, 2], [5, 0, 4], [2, 4, 0]]

mds = MDS(n_components=2, dissimilarity='precomputed', random_state=42)

coords = mds.fit_transform(data)
Using the Scikit-learn library allows you to transform complex consumer sentiment into 2D coordinates. This method ensures your Perceptual Map is mathematically sound, moving beyond the “subjective hunch” often found in amateur marketing plans.
Choosing Your Engine: MDS vs. Correspondence Analysis
Not all maps are created equal. Depending on your data source—whether it’s Likert scale surveys or Frequency tables—you must choose the correct statistical approach.
| Feature | Multidimensional Scaling (MDS) | Correspondence Analysis (CA) |
| Primary Data Input | Similarity/Distance Ratings | Categorical/Frequency Data |
| Best For | Identifying underlying dimensions | Visualising brand vs. attribute relationships |
| Output Type | Spatial Map | Biplot (Points and Vectors) |
| 2026 Use Case | Competitive Brand Clustering | Sentiment Attribute Mapping |
Phase 3: Plotting the Competitors
You must be brutal here. Don’t just plot the brands you like. Plot the ones you’re afraid of. Include the digital marketing services that are eating your lunch via better SEO and social presence.
When plotting, we often use Multidimensional Scaling (MDS). Instead of asking people to rate you on “Speed,” we ask them “, How similar is Brand A to Brand B?”
The computer then calculates the coordinates. If the market can’t tell you apart from a cheaper rival, your brand differentiation strategy has failed.

The Myth of the “Empty Space”
Here is the “Consultant’s Reality Check.” I once audited a client in the B2B SaaS space. They were ecstatic because they found a huge gap in their perceptual map: “High Security/Manual Data Entry.” They wanted to build a product there.
I had to tell them the hard truth: The gap was empty because no one wanted that combination. Just because there is white space on a map doesn’t mean there is a market.
You must cross-reference your map with a competitive analysis to determine if the gap represents a “Blue Ocean” or merely a desert.
A true blue ocean strategy requires a gap that aligns with an unfulfilled consumer need, not just a lack of competition.
Phase 4: Finding Your “Ideal Point”
In advanced mapping, we don’t just plot brands; we plot “Ideal Points.” This is a coordinate that represents the “perfect” brand for a specific segment of customers.
- If the Ideal Point for “Gen Z Entrepreneurs” is far away from all existing brands, you have a massive opportunity.
- If all brands are huddled together but the Ideal Point is 2 inches to the left, the first brand to move there wins the market.
This is where niche branding becomes powerful. You don’t need to be the best for everyone; you just need to be the closest brand to a specific cluster of Ideal Points.
Debunking the “Simplicity” Myth: Why 2D Maps Often Lie
Most “experts” tell you to keep it to two axes. They are wrong. The market is multidimensional. While a 2D map is good for a quick presentation, real strategy happens in 3D or through a series of layered maps.
Using Snake Plots (a rare attribute in mapping) allows you to compare brands across 10-12 attributes simultaneously.
This reveals where your brand “leaks” authority. You might be winning on “Trust” and “Expertise” but losing so badly on “Accessibility” that your brand visibility is tanking.
The State of Perceptual Mapping in 2026
We are currently seeing the rise of Generative Perceptual Mapping. By using API hooks into social listening tools and LLMs, we can generate a map based on the last 24 hours of public discourse.
Pricing for these tools has dropped by 60% in the last 14 months, making high-level STP marketing accessible to SMBs, not just the FTSE 100.
If you aren’t using real-time data to monitor your brand repositioning, you are essentially flying a plane with a broken altimeter.
Steps to Create Your Map (The Inkbot Method)
- Define the Scope: Are you mapping a whole category or just a sub-niche?
- Select Discriminant Attributes: Don’t use Price. Use things like “Provocative vs Safe” or “Peer-Led vs Expert-Led.”
- Survey Your Market: Use a sample size that matters. Nielsen recommends at least 200-300 responses for statistical significance in B2C.
- Normalise the Data: Use Z-scores to ensure one “enthusiastic” responder doesn’t warp the entire map.
- Plot and Verify: Look for clusters. Identify the “Death Zones.”
- Find the Ideal Point: Where does your target audience wish you were?
The Verdict
A perceptual map isn’t a “nice-to-have” graphic; it’s the foundation of any brand that intends to survive the next decade.
It tells you if you are a leader, a follower, or a ghost. If you find yourself in a crowded quadrant, you don’t need a better logo; you need a better position.
If you’re tired of guessing where your brand fits or why your “unique” selling points are being ignored, it’s time to look at the data. Stop squinting at the market and start mapping it.
Ready to find your gap?
Request a quote for a comprehensive brand audit or visit Inkbot Design to see how we help SMBs reclaim their market position.
Market Gap Strategy Evaluator
Found a potential gap on your map? Use this logic-engine to determine if it’s a profitable Blue Ocean or a dangerous “Phantom Gap.”
1. Choose your primary “Rare Attribute” axis:
2. Describe the “White Space” you’ve identified:
You are making noise, not impact.
Your current position is a “Me-Too” trap. To survive 2026, you must pivot one axis toward a Rare Attribute that your rivals are too slow to adopt. You don’t need a better logo; you need a better coordinate.
Fix My Positioning →Verify before you invest.
Total voids are often empty because there is no profit there (e.g., “High Price/Low Quality”). You must cross-reference this gap with LLM sentiment data to see if an “Ideal Point” actually exists in this space.
Request a Market Audit →Move fast and claim the territory.
This is the “Aldi/Lidl” scenario. You’ve found where the customer wants to be, but the market leaders are too bloated to move there. Your branding should focus 100% on owning these two specific axes.
Scale Your Brand Now →Frequently Asked Questions (FAQ)
What is the primary purpose of a perceptual map?
It visualises how consumers perceive your brand relative to competitors. By plotting brands on axes representing key attributes, you can identify “white space” or market gaps where consumer needs are not being met, allowing for more strategic brand positioning and targeted marketing efforts.
How many dimensions should a perceptual map have?
While most are 2D (X and Y axes) for clarity, complex markets often require 3D models or multiple maps to capture all “Discriminant Attributes.” Using too few dimensions can oversimplify the market, leading to a “Phantom Gap” that doesn’t actually exist in reality.
What is the difference between a perceptual map and a positioning map?
A Perceptual Map reflects the consumer’s current reality (how they actually perceive the brand), while a Positioning Map reflects the brand’s desired identity (how the brand wants to be perceived). A gap between these two indicates a Brand Perception Gap.
How do you create a perceptual map in 2026?
Identify Attributes: Select two Discriminant Attributes (e.g., Sustainability vs. Performance).
Collect Data: Utilise API-driven sentiment analysis or conduct consumer surveys (n> 300).
Score Competitors: Rate each brand on a scale (1-10) for selected attributes.
Plot Coordinates: Use the X and Y axes to place brands based on average scores.
Identify Gaps: Locate “White Space” that aligns with an Ideal Point.
What is Multidimensional Scaling (MDS) in mapping?
MDS is a statistical technique used to create a map based on the perceived “similarity” between brands rather than ratings on specific attributes. It provides a more objective view of the market landscape by letting the data determine the coordinates without researcher bias.
Can a perceptual map help with brand repositioning?
Yes. It shows your current “as-is” position and helps you plot a course to your “to-be” position. By identifying the “Ideal Point” of your target audience, you can adjust your messaging and product features to move closer to that high-value coordinate.
What is a “Phantom Gap” in market mapping?
A Phantom Gap is an empty area on a perceptual map that appears to be an opportunity but is actually a “Death Zone.” It usually represents a combination of attributes that no one actually wants (e.g., “Luxury items with no brand name”), leading many SMBs into failed product launches.
How often should I update my perceptual map?
In 2026, static annual maps will no longer be sufficient. With social sentiment shifting rapidly, brands should ideally use real-time data or at least quarterly updates to ensure their positioning remains relevant. The “fresher” the data, the more accurate your strategic decisions will be.
Does a perceptual map work for B2B brands?
Absolutely. In B2B, the axes often shift toward “Risk Mitigation,” “Integration Ease,” or “Long-term ROI.” Mapping these helps B2B firms understand why they might be losing to a competitor who has lower “Technical Debt” or better “Support Reputation.”
What tools are used to create these maps?
Professional strategists utilise statistical software such as SPSS or R for Correspondence Analysis. However, for most SMBs, survey tools like Typeform or Fillout combined with specialised mapping software (or even a well-structured Excel template) can provide sufficient visual data for strategic planning.
Is consumer perception always accurate?
Perception is the only reality in branding. Even if your product is technically “better,” if the perceptual map shows you are “Lower Quality” than a rival, that is the truth you must fight. The map reveals the hurdles you need to clear with your marketing and PR.
What is an “Ideal Point” on a map?
An Ideal Point is a coordinate representing the “perfect” combination of attributes for a specific customer segment. Mapping your brand’s distance from this point tells you exactly how much work is needed to capture that segment’s loyalty and market share.

