Behavioural Analytics: See Your Site Through Your Customers’ Eyes
You have website data. Charts, graphs, percentages. You know your traffic, your top pages, and your bounce rate. But you probably don’t have the truth.
Most businesses look at their analytics and see numbers. They are looking at a scoreboard. It tells you the final score—you made 10 sales, you got 50 leads. It tells you nothing about how the game was actually played.
It doesn’t show the customer who tried to buy but couldn’t find the checkout button. It doesn’t show the potential client who left your site frustrated because your contact form was broken.
Behavioural analytics is the game tape. It lets you watch the plays. It shows you the fumbles, the missed opportunities, and the winning moments you never knew you had. It’s the difference between knowing what happened and understanding why.
This guide will show you what it is, why it matters more than your current reports, and how to start finding real answers—for free.
- Behavioural analytics reveals why users behave as they do, not just what happened, by observing real interactions like clicks and scrolls.
- Session replays and heatmaps pinpoint usability issues quickly—sometimes five recordings beat a lengthy analytics report.
- Metrics like bounce rate can be misleading; context (scroll depth, engagement, goal completion) matters more.
- Small businesses can start free with Microsoft Clarity and adopt a 30‑minute weekly habit to find high‑impact fixes.
- Combine quantitative and qualitative data: use numbers to spot problems and replays/surveys to understand and fix them.
What is Behavioural Analytics (And What It Isn’t)
At its core, behavioural analytics is observing what users do. Not what they say they do. Not what you think they do. What do they do when interacting with your website, app, or product?
It’s about tracking actions to understand habits, patterns, and motivations over time.
It’s About the ‘Why’, Not Just the ‘What’
Traditional web analytics, like Google Analytics, which most of us grew up with, is excellent at telling you what happened.
- You had 5,000 visitors last month.
- Your top landing page was your services page.
- 70% of your traffic came from mobile devices.
This is valuable information. But it’s incomplete. It’s the what.
Behavioural analytics delivers the why.
- Why did 80% of those 5,000 visitors leave without contacting you? A session replay shows them struggling with a confusing navigation menu.
- Why is your services page the top landing page but has a low conversion rate? A heatmap shows that users are clicking on a section that isn’t a link, completely ignoring your main call-to-action button.
Think of a restaurant manager. Traditional analytics is the report on her desk that says 50% of diners left without ordering dessert. Behavioural analytics is the security camera footage that shows her that those diners couldn’t read the dessert menu because the font was too small.
One tells you there’s a problem. The other shows you precisely what it is.
Let’s Kill a Sacred Cow: The Myth of Bounce Rate

For years, business owners have been conditioned to fear a high “bounce rate.” This is my first pet peeve with traditional analytics. The belief that a high bounce rate is always alarming is lazy and, frankly, wrong.
A “bounce” simply means a user viewed a single page and then left. That’s it. It has no inherent positive or negative meaning without context.
Consider these scenarios where a high bounce rate is a sign of success:
- A user finds your blog post via Google, gets the exact answer they need, and leaves satisfied. Job done.
- A potential customer lands on your contact page, finds your phone number, and calls you. They bounced, but you just got a lead.
- A visitor checks your pricing page, decides it’s too expensive, and leaves. That’s a qualified-out lead, saving everyone time.
Obsessing over bounce rate is a classic case of valuing a metric over the actual user experience. You are better off focusing on indicators like scroll depth (how far down the page they went?), engagement time, and whether they completed a specific goal.
It’s Not Just for Tech Giants Like Netflix and Amazon
When you hear “behavioural analytics,” you might think of Amazon recommending products you didn’t know you needed or Netflix queuing up the perfect show. They are the masters of this, using immense data sets to predict behaviour and personalise experiences.
But that’s the Premier League. You don’t need to be.
The core principles are the same, and the tools once exclusive to Silicon Valley are now accessible, easy to use, and in some cases, completely free. You don’t need a team of data scientists. You need a bit of curiosity.
The Core Four: Your Behavioural Analytics Toolkit
You don’t need a dozen complex tools. For most small businesses, a vast portion of the value comes from just four key types of analysis. Master these, and you’ll be ahead of 90% of your competitors.
1. Session Replays: The Over-the-Shoulder View
This is the showstopper. Session replays are anonymous recordings of real user visits to your website. You can watch a replay of their mouse movements, clicks, typing, and navigation from page to page.
It is the closest you can get to sitting next to a customer and watching them use your site.
You’ll see where they get stuck. You’ll find bugs you never knew existed. You’ll watch them “rage click”—repeatedly clicking on an element that isn’t working—and feel their frustration. Five-session replays often give you more actionable insight than a 50-page analytics report.
2. Heatmaps: The Visual Story of Clicks and Attention

A heatmap is a visual representation of user interaction overlaid directly onto your webpage. It uses colours—typically red for high activity and blue for low activity—to show thousands of visitors’ aggregate behaviour.
There are three main types you’ll use:
- Click Maps: Show you exactly where people click (or tap on mobile). They instantly reveal if users are ignoring your most essential buttons or clicking on things that aren’t links.
- Move Maps: Track where users move their mouse cursor on the screen. This is a powerful proxy for where their attention is focused.
- Scroll Maps: Show you how far down the page most users scroll. You might discover that 85% of visitors never even see the critical information you placed “below the fold.”
3. Funnel Analysis: Finding the Leaks in Your Bucket
A funnel is a series of steps a user must complete to achieve a goal. The most common example of an e-commerce store is the checkout funnel:
- View Product Page
- Add to Cart
- Begin Checkout
- Complete Purchase
Funnel analysis tracks how many users make it from one step to the next. It shows you exactly where the most significant leaks are in your process. If 90% of users who add a product to their cart make it to the checkout page, but only 20% of those complete the purchase, you’ve pinpointed the exact stage that’s costing you the most money.
4. User Feedback & Surveys: Just Ask Them Directly
Sometimes, the most straightforward approach is the best. Behavioural analytics isn’t just about passively observing; it’s also about proactively asking.
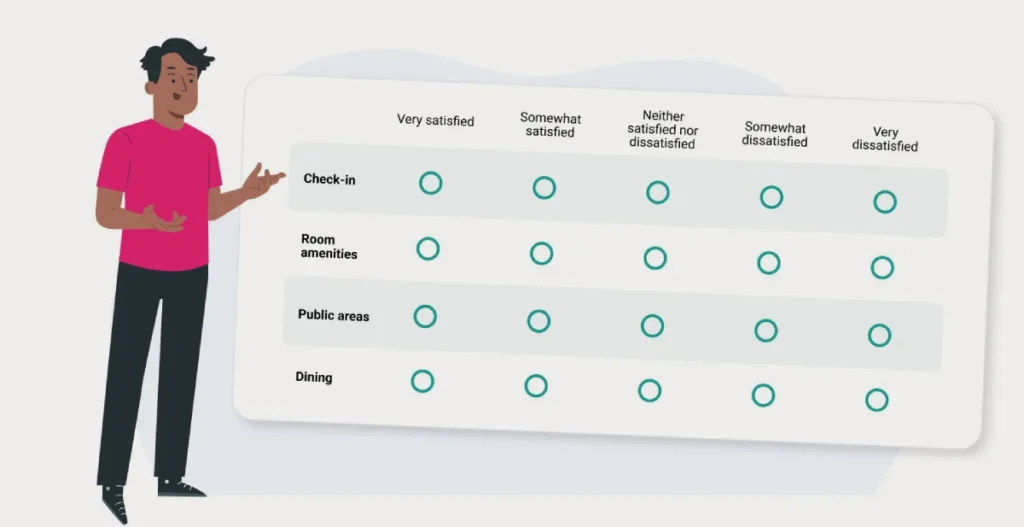
Modern tools allow you to deploy small, unobtrusive surveys on your site. You can set up a simple poll that appears on a page where users are dropping off, asking a direct question like:
- “What’s the one thing preventing you from signing up today?”
- “Were you able to find the information you were looking for?”
This captures the user’s voice and intent at the precise moment of friction, providing qualitative context you can’t get anywhere else.
A Real-World Walkthrough: Finding and Fixing a Problem in Under an Hour
Let’s make this practical. Imagine you run an online store selling custom coffee blends. You’re getting traffic, but sales are flat.
Step 1: The Alarm Bell (The ‘What’) – 5 minutes. You log into your Google Analytics. The report shows a high “exit rate” on your main checkout page. Many people start the process but do not finish it. You know what the problem is, but not why.
Step 2: The Investigation (The ‘Why’) – 30 minutes. You can open up a free behavioural tool like Microsoft Clarity, which is installed on your site.
First, you look at the heatmap for the checkout page. You notice something strange. The fields for “Name” and “Address” are bright red with clicks, but the field for “Coupon Code” is ice cold. Almost no one is interacting with it.
Next, you filter for session replays of users who abandoned their cart on this page. You watch three recordings back-to-back. The story is the same: the user breezes through their name and address, then stops. They start erratically moving their mouse around the page, looking for something. In two recordings, you see the user type a coupon code into the “Address Line 2” field out of frustration before giving up and leaving the site.
Step 3: The Hypothesis – 5 minutes The checkout page has a small, grey text link that says “Have a coupon code?” When clicked, it reveals the field to enter the code. The recordings and heatmap make it obvious: users don’t see the link. They have a code, can’t find where to put it, and abandon the purchase.
Your hypothesis: “The coupon code field is not visible enough, causing user frustration and costing us sales.”
Step 4: The Fix – 15 minutes You contact your web developer with a simple instruction: “On the checkout page, please make the coupon code field a prominent, open text box by default instead of a hidden link.
This entire process of finding and validating a revenue-killing problem took less than an hour. That is the power of this approach. Finding and fixing conversion blockers is the core of effective digital marketing. It’s about optimising the journey for the users you already have.
Getting Started: Your First Steps This Week
Feeling overwhelmed? Don’t be. You don’t need to change your entire business overnight. You need to build a new habit.
Ditch “Data-Driven.” Become “Data-Informed.”
This is my second pet peeve. The phrase “data-driven” is thrown around constantly, implying that the data is in charge. It suggests a world where human intuition and expertise are secondary to what the spreadsheet says. That’s a mistake.
A better mindset is to be “data-informed.” Data is your co-pilot. It provides objective evidence to help you, the expert, make better decisions. You use the insights from watching a session replay to inform your gut feeling about a design change. It’s a partnership between observation and experience.
Your First Tool Is Free: Install Microsoft Clarity
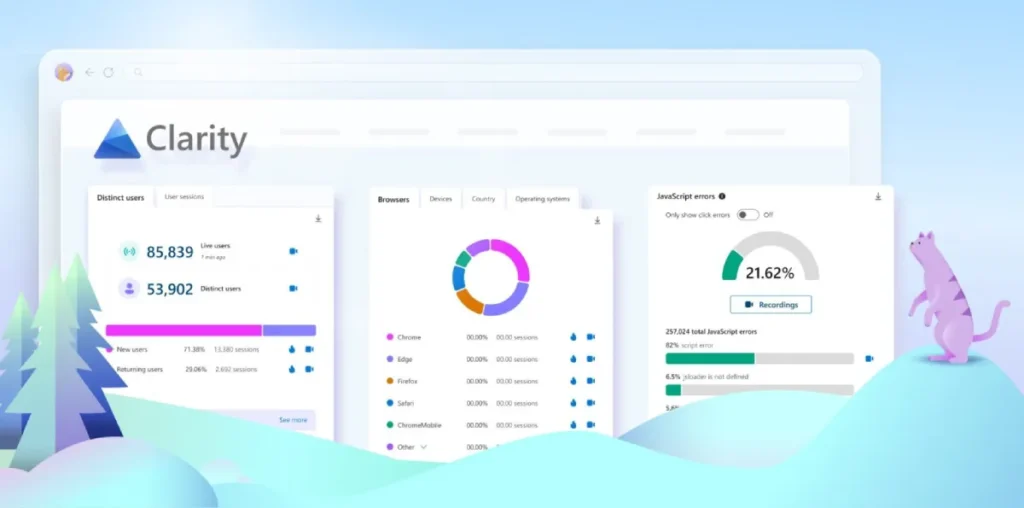
You don’t need to pay for a tool to get started. Microsoft Clarity is 100% free, forever. It gives you session replays, all three types of heatmaps, and fundamental funnel analysis. It’s incredibly powerful and is all you’ll ever need for most small businesses.
Installation is simple:
- Go to the Microsoft Clarity website and sign up with a Microsoft account.
- Create a new project and enter your website’s URL.
- Clarity will give you a small snippet of code (a tracking script).
- Copy and paste this code into your website’s HTML <head> section. If you use WordPress, some plugins make this a simple copy-and-paste job.
That’s it. Within a few hours, data will start appearing in your dashboard.
The 30-Minute Weekly Habit for Finding Gold
Don’t try to analyse everything. Don’t aim to watch hundreds of recordings. Create a small, manageable routine that you can stick to.
Block 30 minutes on your calendar every Friday. During that time, do only three things:
- Watch 10 session replays of users who visited a significant page but didn’t convert.
- Look at the heatmap for your single most crucial landing page.
- Write down one—just one—observation or idea for a change.
This simple habit, practised consistently, will provide a steady stream of high-quality insights that will put you miles ahead of competitors still staring at their bounce rate.
When Numbers Lie: The Danger of Quantitative Tunnel Vision
Here is my final pet peeve: the obsession with quantitative data at the expense of common sense. Numbers tell you what’s happening at scale, but they can’t tell you the story of a single, frustrated customer. And sometimes, that one story is all that matters.
I know a company that saw a small but steady 0.5% drop in its overall conversion rate. The alarm bells went off. They spent two weeks pulling spreadsheets, analysing traffic sources, and building complex reports. They blamed a recent marketing campaign. They blamed a Google algorithm update.
The real reason? A junior developer had pushed an update to their cookie consent banner. The banner now covers the “Complete Purchase” button on a specific mobile screen size.
No spreadsheet in the world would have told them that. But a single, two-minute session replay would have shown them the problem instantly.
The quantitative data (the what) told them there was a fire. The qualitative data (the why) showed them that a blanket covered the stove. You need both.
The Real Truth of Analytics
Behavioural analytics isn’t about becoming a data wizard. It’s about developing customer empathy.
It’s about having the humility to accept that the brilliant design you laboured over might be confusing. It’s about being curious enough to discover why people are leaving your site instead of counting how many of them do.
The answers to your biggest business challenges are already there. They are hidden in the clicks, scrolls, and hesitations of the people visiting your website daily.
Stop chasing metrics. Start watching people.
Ready to Turn Insights into Action?
Understanding your users is half the battle. Turning those insights into a design and marketing strategy that drives growth is the other half. Learn about our digital marketing services if you’re ready to connect the dots. Or, if you have a specific challenge you want to solve, request a quote and let’s talk.
Frequently Asked Questions (FAQs)
What is the main difference between behavioural analytics and Google Analytics?
Google Analytics (GA) primarily provides quantitative data—it tells you what happened (e.g., how many visitors you had, which pages they viewed). Behavioural analytics provides qualitative data—it helps you understand why it happened by using tools like session replays and heatmaps to show how users interact with your site.
Is behavioural analytics hard to learn?
No. While the field can be complex at the highest levels, the basic tools and concepts are intuitive for business owners. If you can watch a video, you can analyse a session replay. Modern tools like Microsoft Clarity are designed for non-technical users.
What is the best free behavioural analytics tool?
Microsoft Clarity is the best free option for most small and medium-sized businesses. It offers session recordings, heatmaps, and fundamental funnel analysis at no cost.
How many session recordings do I need to watch?
You don’t need to watch hundreds. Watching just 5-10 recordings of users on a specific problematic page will often reveal patterns and major usability issues. The goal is to find actionable insights, not watch every visitor.
Can behavioural analytics slow down my website?
Modern behavioural analytics tools are designed to have a minimal impact on site performance. The tracking scripts load asynchronously, which means they don’t block your page from loading for the user. For the vast majority of sites, the impact is not noticeable.
Is tracking user sessions legal (GDPR/CCPA)?
Yes, when done correctly. Reputable tools automatically anonymise user data, scrubbing personal information like names, email addresses, and passwords from recordings. However, it’s always best practice to mention the use of such tools in your website’s privacy policy.
What is a “rage click”?
A rage click is when a user clicks repeatedly and rapidly in the same spot on a webpage. It’s a strong behavioural indicator of frustration, usually because a button or link is broken, or they believe something should be clickable when it isn’t.
How can behavioural analytics help my SEO?
By improving user experience. Search engines like Google want to send users to pages that are helpful and easy to use. By using behavioural analytics to find and fix user frustrations, you can increase “dwell time” (how long users stay on your site) and improve overall engagement—signals that can positively influence your search rankings.
What’s a more critical tool: heatmaps or session replays?
They serve different purposes. Heatmaps are great for quickly seeing aggregate patterns and identifying potential problem areas (“Where is everyone clicking?”). Session replays are essential for diagnosing the why behind those patterns by watching individual user journeys. It’s best to use them together.
How do I create a funnel in an analytics tool?
In most tools, you define a funnel by specifying a sequence of URLs a user would visit to complete a goal. For example, a checkout funnel might be described as: Step 1: your-site.com/cart, Step 2: your-site.com/checkout, Step 3: your-site.com/thank-you. The tool will then show you how many users progress through each step.
Can I use this for my B2B business?
Absolutely. Behavioural analytics is extremely valuable for B2B websites. You can watch how potential clients interact with your services pages, where they drop off in your lead generation forms, and whether they are engaging with your case studies and white papers.
How often should I check my behavioural analytics data?
For most small businesses, a weekly check-in is sufficient. A consistent, 30-minute weekly habit is more effective than an intense, all-day session once a quarter.