Customer Journey Mapping: The Brand Manager’s Guide
There is a statistic from Bain & Company that comes to mind; it should bother you, too.
It is called the “Delivery Gap.” Their research found that 80% of companies believe they deliver a “superior experience,” but only 8% of their customers agree. (Source)
That is not a margin of error. That is a delusion.
As a brand consultant, I frequently observe this disconnect. A CEO sits in a boardroom looking at a polished PowerPoint deck that shows a customer moving seamlessly from an Instagram ad to a website checkout, then becoming a loyal brand advocate. It looks clean. It looks logical.
In the real world, that customer clicked the ad, landed on a page that took six seconds to load, got confused by the shipping costs, abandoned the cart, received a desperate spam email three hours later, and eventually bought from a competitor on Amazon because the delivery date was guaranteed.
Customer Journey Mapping is not about drawing pretty lines on a whiteboard. It is a forensic audit of your business. It is the process of bringing your brand’s internal assumptions out into the cold light of day and comparing them against the chaotic, messy, and emotional reality of what your customers actually experience.
If you are an SMB owner or a brand manager, you cannot afford to guess where you are losing money. You need to know exactly where the friction lies.
- Customer journey mapping is a forensic audit, exposing real customer behaviour versus internal assumptions to find hidden revenue-draining friction.
- Effective maps combine three layers: customer actions, emotions, and internal operations — without any one layer the map is incomplete.
- Reject linear funnels; account for loops, stalls and channel switching in the "Messy Middle" to reflect real customer paths.
- Prioritise Peak and End moments — a weak checkout or unboxing can taint the entire experience despite average performance elsewhere.
- Build maps from data (quantitative, qualitative, observational), assign ownership, update regularly, and use them to break organisational silos.
What is Customer Journey Mapping?
In the context of strict brand experience management, Customer Journey Mapping is the strategic visualisation of the process a customer goes through to achieve a goal with your company.
It is not just a timeline. A functional map must combine three layers of data:
- The Action: What the customer is doing (e.g., searching Google, reading a review, clicking “buy”).
- The Emotion: How the customer feels at that exact moment (e.g., frustrated by a form, relieved by a confirmation email, anxious about shipping).
- The Operation: What is happening internally to support that moment (e.g., the server loading the database, the warehouse packing the box, the API triggering the email).
If your map lacks the operational layer, it is just a cartoon. If it lacks the emotional layer, it is just a flowchart.
The “Linear Journey” Myth
Before we begin mapping, we need to dispel a common misconception. Traditional marketing education taught us the “Funnel”:
Awareness > Interest > Desire > Action.
This model is a relic. It assumes humans are rational robots who move in a straight line.
Google’s researchers coined a term for what actually happens: “The Messy Middle.” Between the trigger (I need new running shoes) and the purchase, a customer enters a loop of exploration and evaluation that can last anywhere from a few minutes to several months. They might visit your site, open three tabs of competitors, check Reddit for honest reviews, set it aside for a week, see a retargeting ad, and then finally make a purchase.
If your customer journey map is a straight line from left to right, it is wrong. A robust map accounts for:
- Loops: Customers returning to previous stages.
- Stalls: Periods of inactivity where the brand must remain top-of-mind without being annoying.
- Channel Switching: Moving from mobile to desktop, or social media to email.
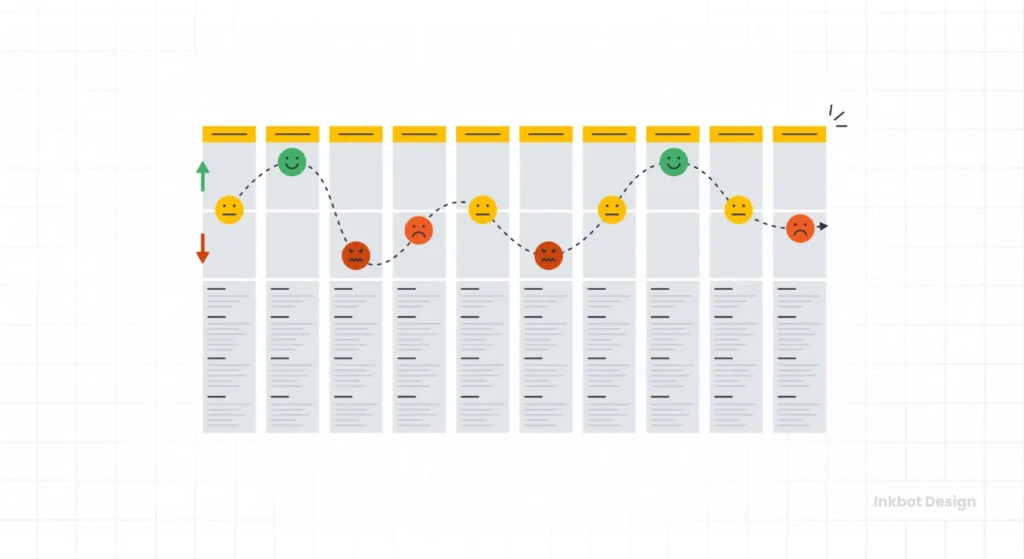
The Peak-End Rule
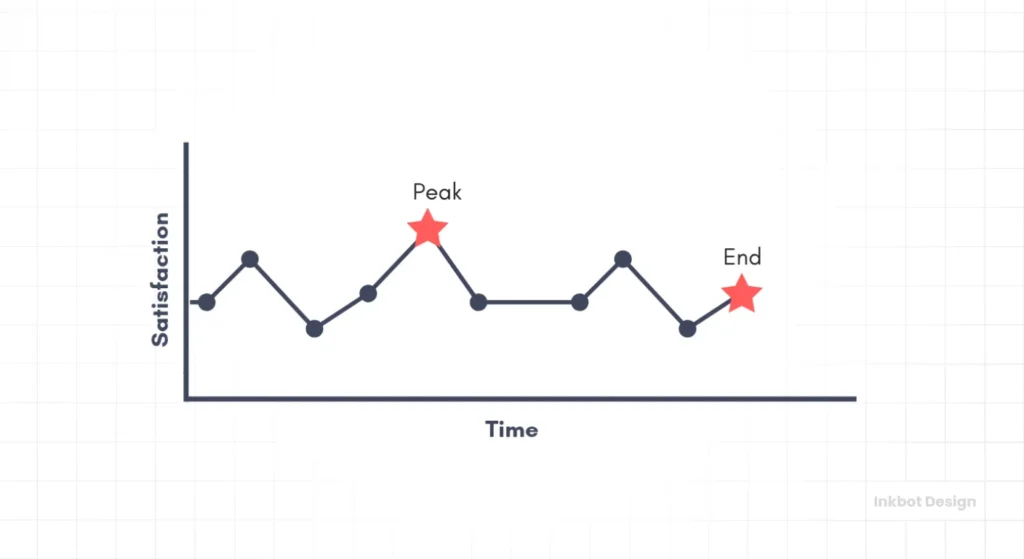
Psychology tells us that customers do not remember the entire journey. According to the Peak-End Rule (popularised by Daniel Kahneman), people judge an experience largely based on how they felt at its peak (the most intense point) and at its end, rather than the total sum or average of every moment.
The implication for you: You can have a perfectly average website, but if your checkout process (The End) fails or your unboxing experience (The Peak) is mediocre, the entire journey is rated as a failure.
Thinking, Fast and Slow
You think you’re a rational person, but your brain’s flawed operating system is costing you. This book is the user manual. It reveals the two systems driving your decisions—one fast and biased, the other slow and logical. Learn how to spot your mental flaws and make better choices.
As an Amazon Partner, when you buy through our links, we may earn a commission.
Phase 1: The Pre-Touch (The Zero Moment of Truth)
The journey begins before they even know your name. In 2011, Google introduced the Zero Moment of Truth (ZMOT). This is the research phase. In 2026, this has evolved into “predictive discovery” through the use of AI and algorithm-driven suggestions.
Your customer is currently solving a problem that you solve, but they are doing it without your help.
Key Questions for Mapping:
- What specific query types lead them to the category? (Informational vs. Transactional).
- Where does the “Anchor Bias” form? (The first piece of information they see often sets the standard for price and quality.)
The Brand Manager’s Trap:
Thinking the journey starts when they land on your homepage. It doesn’t. It starts when they ask ChatGPT, “What is the best CRM for small design agencies?” If you aren’t part of that answer, your journey never begins.
Phase 2: The First Touch (Brand Promise vs. Reality)
This is the moment of contact. It could be a PPC landing page, a cold call, or a shop window. This is where the Brand Promise is put to the test.
If your brand identity screams “Premium, High-End, Exclusive,” but your website takes 4 seconds to load and has a pop-up wheel asking them to “Spin to Win 10% Off,” you have created an immediate cognitive dissonance. You promised luxury; you delivered a bazaar.
The 3-Second Rule
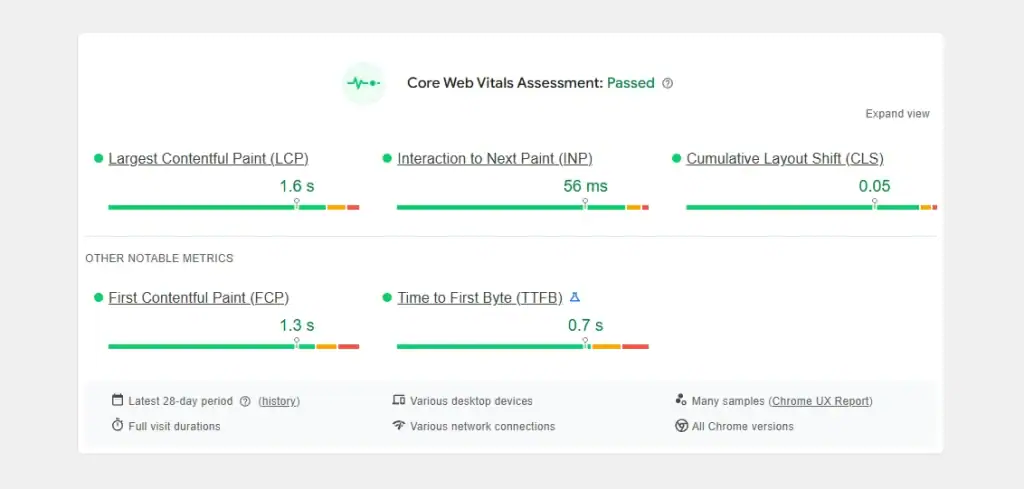
Data from Google indicates that as page load time goes from 1 second to 3 seconds, the probability of bounce increases by 32%. In strict economic terms, a slow interface is tantamount to rejecting the customer.
Action Item:
Map the “First Touch” friction.
- Technical: Load speeds, layout shifts (CLS).
- Cognitive: Does the headline match the ad copy? (Message Match).
- Emotional: Does the user feel welcomed or hunted?
Consultant’s Note: We once audited a B2B SaaS client who was spending £50,000 a month on LinkedIn ads. The ads were brilliant—slick, professional, promising “enterprise-grade security.” The landing page, however, had a broken SSL certificate warning. The journey ended instantly for 95% of traffic. No amount of “nurturing” fixes a broken front door.
Phase 3: The Core Interaction (The Friction Audit)
This is the “Messy Middle.” The customer is comparing you. They are looking at pricing, features, and social proof.
Here, you must map the Cognitive Load. Every time you ask a user to think, you risk losing them.
The “Sign-Up” Wall
A classic failure point is forcing registration before value delivery. If I have to provide my email address just to view the shipping cost, you have introduced high friction with zero trust.
Real-World Example: Zoom vs. Skype
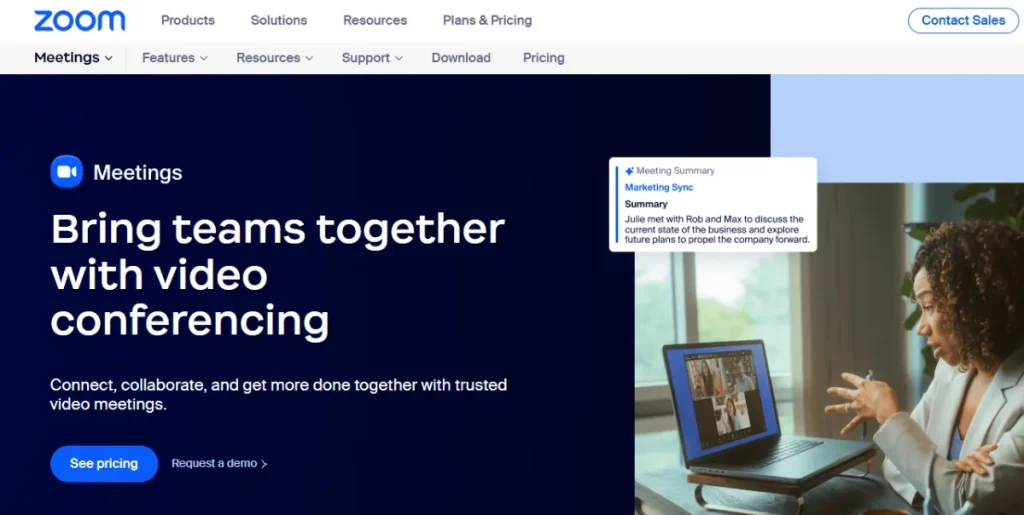
Why did Zoom eat Skype’s lunch? Skype was owned by Microsoft, had massive funding, and millions of users.
- Skype’s Journey: Download app > Create Microsoft Account > Verify Email > Login > Find Contact > Call.
- Zoom’s Journey: Click Link > Join Meeting.
Zoom removed the friction. They mapped the journey and realised the “account creation” step was the barrier to entry. They removed it. That is the power of mapping.
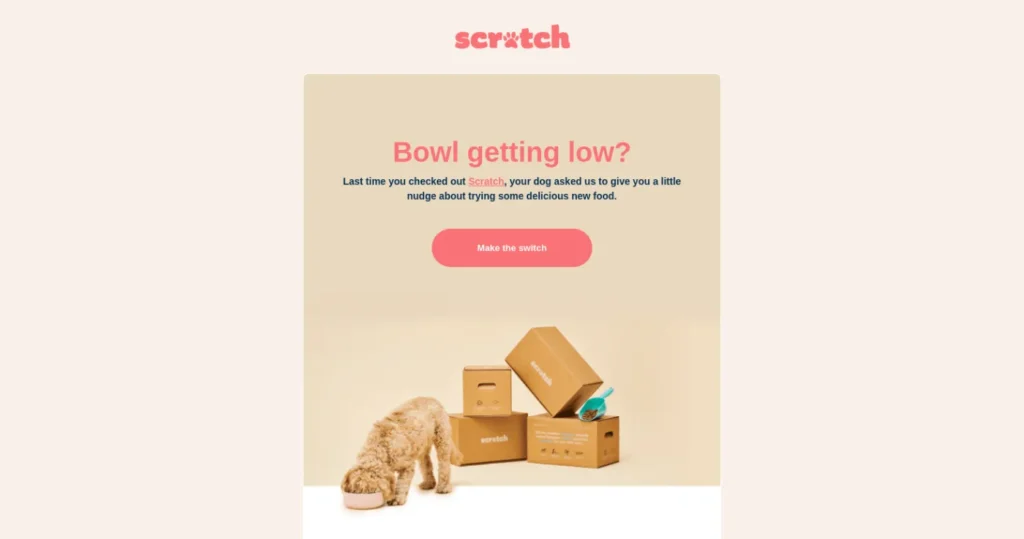
Phase 4: Post-Purchase (The Retention Void)
This is where most SMBs fail. The sale is closed. The revenue is booked. The marketing team high-fives and moves on to the next lead.
Meanwhile, the customer enters the “Post-Purchase Dissonance” phase. They are wondering: Did I waste my money? Is this going to work?
The Gap: Marketing promised “24/7 Support.” Operations provides a chatbot that only understands three phrases.
The Fix:
Your map must continue after the credit card is charged.
- Immediate Confirmation: Not just a receipt, but a reassurance.
- Onboarding: A structured guide to getting value immediately (Time-to-Value).
- The Check-in: A human or personalised automated touchpoint 7 days later.
According to Harvard Business Review, acquiring a new customer is anywhere from 5 to 25 times more expensive than retaining an existing one. Yet, look at your budget. Is 90% of it spent on “Acquisition” (Phases 1-3) and only 10% on “Retention” (Phase 4)? If so, your journey map is upside down.
How to Create a Customer Journey Map (The Forensic Method)
Do not start with a template. Start with data. Here is the framework we use at Inkbot Design.
Step 1: Data Aggregation (The Evidence)
You cannot map what you do not know. Gather these three sources:
- Quantitative Data: Google Analytics (Exit pages, Bounce rates), Heatmaps (Hotjar/CrazyEgg), Sales Funnel conversion rates.
- Qualitative Data: Support tickets (what are people complaining about?), Chat logs, Post-purchase surveys.
- Observational Data: Observe a stranger attempting to purchase your product. Do not help them. Watch where they get stuck.
Step 2: Define the Persona
You cannot map “Everyone.” A CTO buying software has a different journey than a Freelancer buying the same software.
Define the Primary Persona. Give them a name. Define their:
- Goal: What do they actually want? (e.g., “I want to save time,” not “I want software”).
- Fear: What are they afraid of? (e.g., “Looking stupid to my boss if this fails”).
Step 3: Plot the Matrix
Create a matrix.
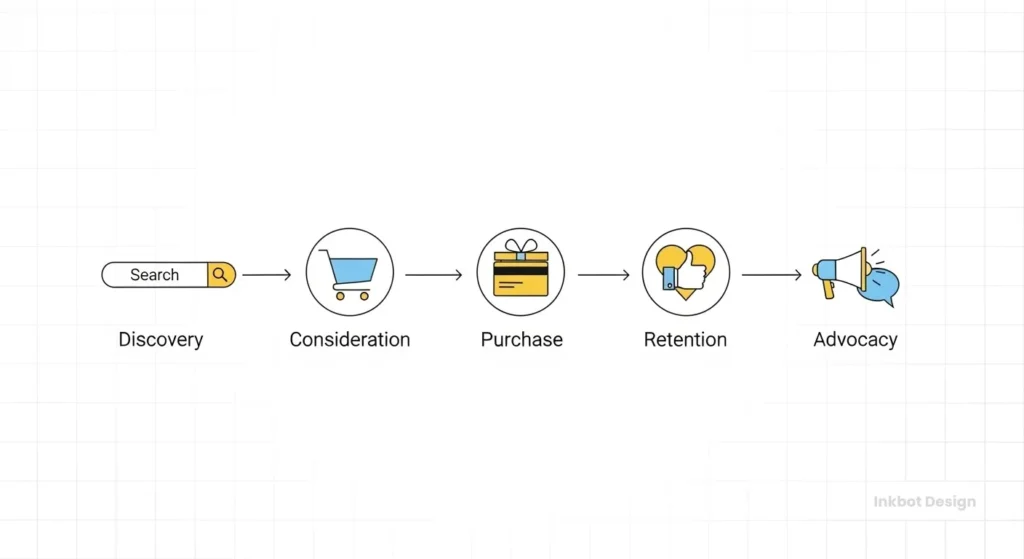
- X-Axis (Horizontal): The Timeline (Discovery > Research > Purchase > Onboarding > Advocacy).
- Y-Axis (Vertical): The Layers (Customer Actions, Touchpoints, Emotional State, Internal Process, Opportunities).
Step 4: The “Pain & Gain” Analysis
For every stage, ask:
- Pain: What is frustrating here? (e.g., “I can’t find the pricing page”).
- Internal Owner: Who is responsible for fixing this? (Marketing? IT? Sales?
- The Fix: What is the specific action to remove the pain?
The Amateur Map vs. The Pro Map
| Feature | The Amateur Map | The Pro Map |
| Data Source | Assumptions & Brainstorming | Analytics, User Interviews, Support Logs |
| Perspective | Inside-Out (What we want them to do) | Outside-In (What they actually do) |
| Scope | Ends at “Purchase” | Continues through Retention & Churn |
| Ownership | “Marketing’s Job” | Assigned to specific departments per stage |
| Format | Static PDF / Poster | Living Document / Dashboard |
The State of Customer Journey Mapping in 2026
The discipline has shifted. We are moving away from static maps toward Dynamic Journey Orchestration.
The Death of “Average”
In 2026, “Average” is dead. AI allows for hyper-personalisation. The journey for a returning VIP customer should be entirely different from that of a first-time visitor. Modern CMS and CX platforms (such as Salesforce or HubSpot) enable you to dynamically alter website content based on a user’s past behaviour.
If you are still showing the “Welcome! 10% Off!” pop-up to a customer who has already made three purchases from you, you are failing to meet customer expectations. You are treating a friend like a stranger.
Predictive Friction
Tools are now available that predict where a user will rage-click or abandon before they do it. This shifts mapping from “post-mortem” (analysing why they left) to “preventative” (intervening before they leave).
The “Silo” Problem
In my experience, the biggest barrier to effective customer journey mapping is not software or data—it is politics.
The Marketing team owns the website. The Sales team owns the CRM. The Support team owns the helpdesk. And none of them talks to each other.
- Marketing promises “Instant Setup.”
- Sales says, “It takes 24 hours.”
- Support says, “It actually takes 48 hours because of a backlog.”
The customer hears three different stories from one brand.
When we consult with clients, we force these heads of department into one room. We put the map on the wall. We point to the gap between “Marketing Promise” and “Support Reality”, and we ask, “Who owns this transition?”
Usually, the room goes silent. That silence is where your revenue is dying.
To improve your brand experience, you must break down silos. The Customer Journey Map is the hammer you use to break them.
The Verdict
Customer Journey Mapping is not an arts and crafts project for the marketing department. It is a strategic imperative. It is the only way to see your business through the eyes of the people who pay your bills.
If you treat it as a box-ticking exercise, you will end up with a pretty poster and a declining bank balance. If you treat it as a forensic audit, you will uncover the hidden friction points that are bleeding revenue.
You have two choices:
- Keep guessing and hoping your customers are happy.
- Map the reality, face the uncomfortable truths, and build a brand that actually delivers on its promises.
Is your brand experience matching your brand identity? If you are unsure, it might be time for an audit. Request a quote today, and let’s align your journey with reality.
Frequently Asked Questions (FAQ)
What is the difference between a Customer Journey Map and a Service Blueprint?
A Customer Journey Map focuses on the customer’s experience (actions, thoughts, feelings). A Service Blueprint focuses on the organisation’s operations (processes, staff, technology) required to deliver that experience. The map is the “front stage”; the blueprint is the “backstage.”
How often should we update our Customer Journey Map?
At least every 6 to 12 months. However, you should update it immediately following any major product launch, website redesign, or significant shift in market conditions. It is a living document, not a historical record.
Do we need expensive software to create a journey map?
No. While tools like UXPressia, Miro, or Smaply are excellent options, you can also start with a whiteboard, sticky notes, or a spreadsheet. The value lies in the data and the insights, not the glossiness of the presentation.
How many personas should we map?
Focus on your top 2-3 revenue-generating personas first. Trying to map every possible user type (the “edge cases”) will dilute your focus. Solve the major pathways for your “Ideal Customer Profile” (ICP) before worrying about the outliers.
What is the biggest mistake brands make with journey mapping?
Assumption. They sit in a conference room and guess what the customer does, rather than actually examining the data or speaking with customers. This results in a “hallucinated” journey that bears no resemblance to reality.
Can B2B companies use customer journey mapping?
Absolutely. In fact, it is arguably more critical for B2B. B2B journeys are longer, involve multiple decision-makers (stakeholders), and have higher contract values. Mapping the consensus-building phase in B2B is vital for sales alignment.
How do I measure the ROI of customer journey mapping?
Measure the metrics associated with the friction points you fix. If you identify a drop-off at the checkout and fix it, the ROI is the increase in conversion rate. Other metrics include Net Promoter Score (NPS), Customer Lifetime Value (CLV), and reduction in support tickets.
What are “Moments of Truth”?
These are critical touchpoints where the customer forms a definitive impression of your brand. The “First Moment of Truth” occurs when customers see the product (on the shelf/site). The “Second Moment of Truth” is when they use it. Failing a moment of truth usually results in churn.
How does AI impact customer journey mapping?
AI allows for “predictive mapping.” Instead of analysing historical data, AI can predict future paths and personalise content in real-time. It moves the discipline from reactive analysis to proactive orchestration.
Who should own the Customer Journey Map?
Ideally, a “Head of Customer Experience” or “Brand Manager.” However, it requires cross-functional buy-in. If Marketing owns it alone, Operations will ignore it. It must be a shared strategic asset that has been ratified by leadership.